Background and methodology
AspenCore’s 11th Design Engineer and Supplier Interface study gathered information from engineers regarding their needs for product information and related services, as well as how and when they interface with suppliers, and how they see the quality and value of that interface.
1,750 engineers from the United States participated in this year’s web-based survey, which ran from January to April 2016. The results presented an accurate and reliable portrait of design engineers’ attitudes, perceptions, and behaviors.
About 65% of participants were design/development engineers. Others were in design/development engineering management, or worked in similar areas of engineering. Engineers ranging in age between 55 and 64-years-old were the largest group, making up 29% of participants. In the survey, most engineers, at 43%, worked in a company with less than 100 full-time employees.

Notable primary end products of these companies included computers/IT/networking; industrial controls, systems, and equipment; consumer electronics/appliances; communication/telecom/broadcasting; electronic sub-assemblies; and automotive/transportation.
Preferences
The study found that just over half of engineers preferred keeping up to date on new technologies. When it came to new product information, 45% of engineers considered that information highly important, closely followed by “how-to” design information. Industry news was least preferred, with few engineers seeing it as being valuable.

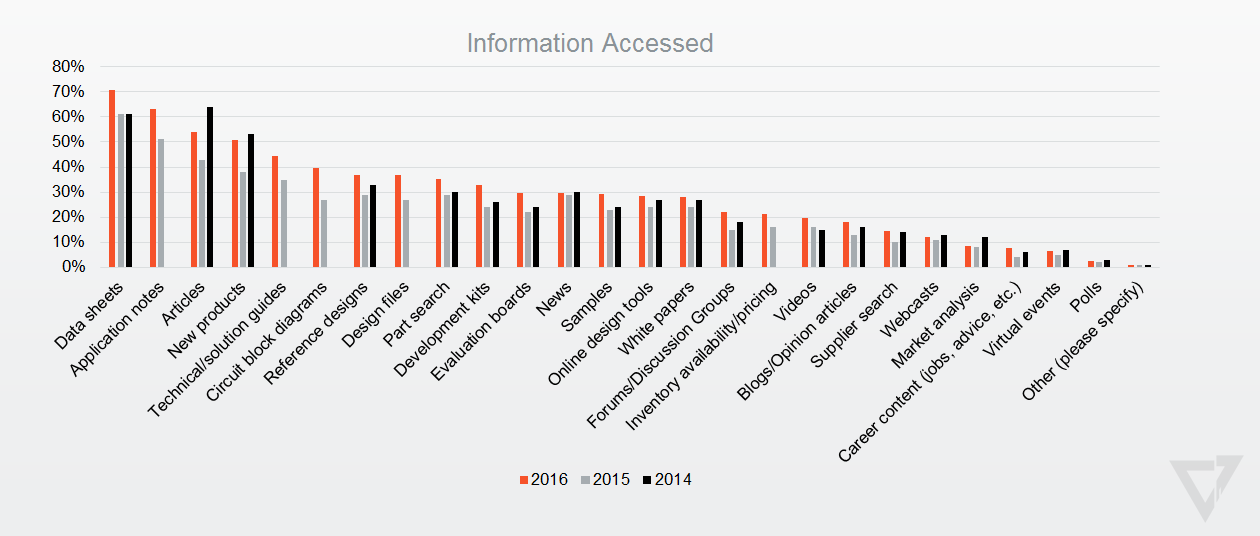
When visiting electronic engineering websites, 70% of engineers accessed data sheets. About 63% accessed application notes, and 55% accessed articles. On the lower end, less than 10% of engineers found interest in polls, virtual events, career advice, and market analysis.
As for registering with a website in exchange for access to information, 43% of engineers went for samples, 40% signed up for application notes, and about 38% did so in exchange for technical/solution guides. There was less interest in e-newsletters, forums, and blogs.
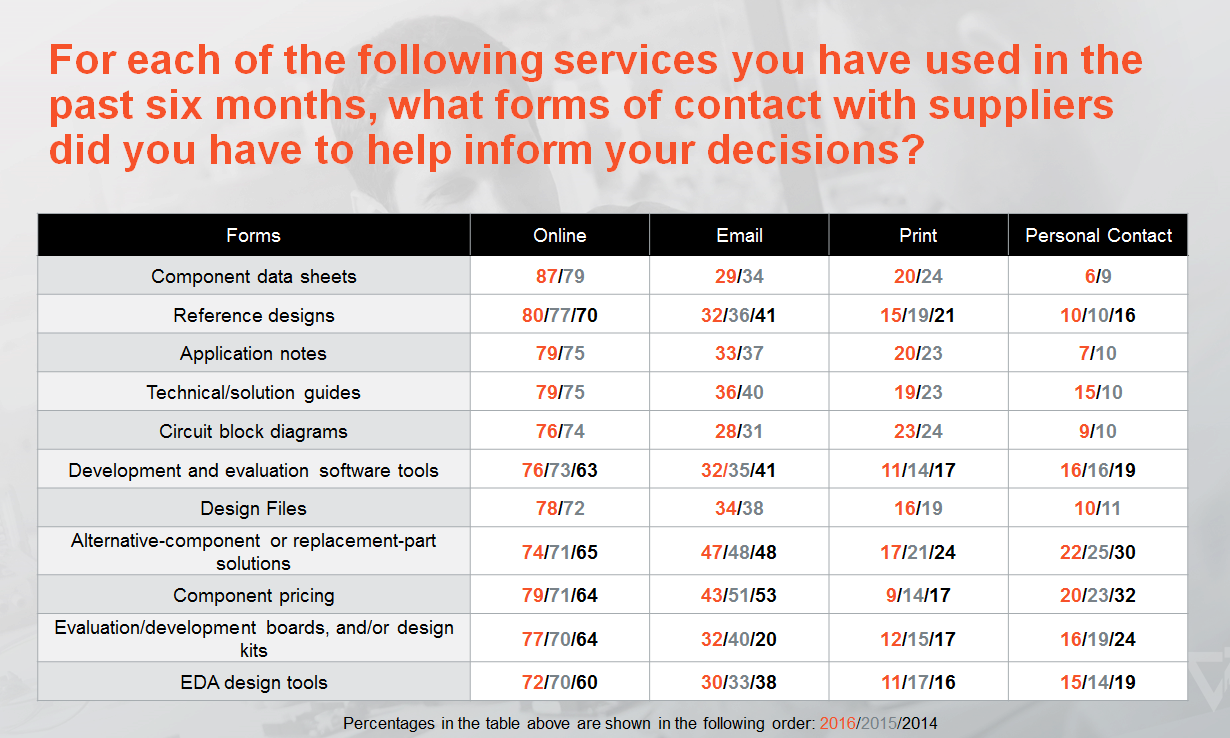
When it came to engagement purposes, 79% of engineers visited websites. Overall, face-to-face meetings were not found valuable.
Purchasing
In the study, 69.9% of engineers said they influenced, recommended, or made the final decision when purchasing electronic components. According to the survey, more than half the engineers have authority to purchase for their company.
When it comes to a company’s purchasing process, the highest percentages of engineers influenced, recommended, or made the final decision on relays and switches, test and measurement equipment, and power sources.

Between 76-99% of engineers purchased electronic components via the Internet. At 36%, power sources were purchased more than any other component on a weekly basis. Design/prototype quantities were purchased more than any other component overall, at 82%.
As for the annual limit of personal purchasing of electronic components, 25% of engineers spent under $1,000, and roughly 23% spent more than $50,000.
Samples
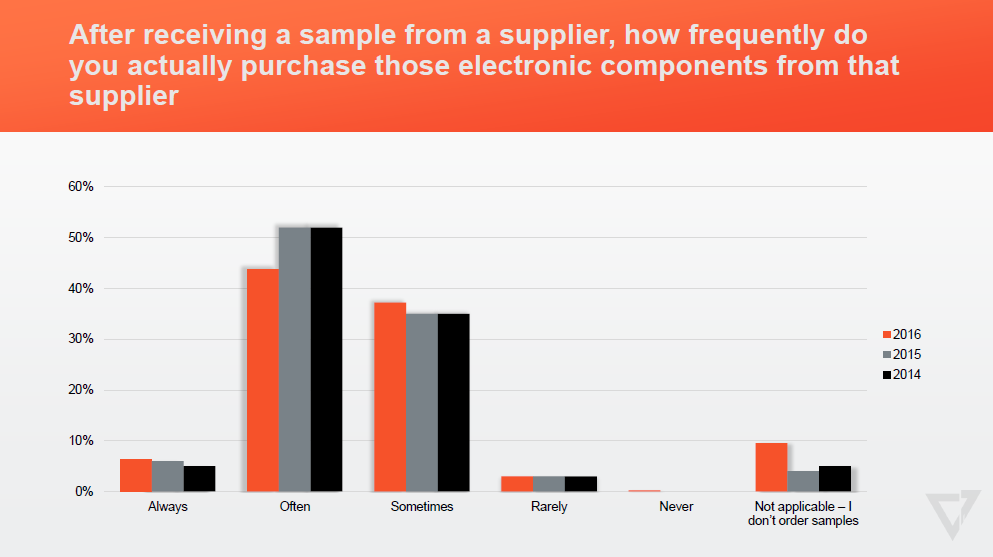
After receiving a sample from a supplier, 43% of engineers said they would often purchase those electronic components from that same supplier. Less than 5% said they would always purchase those electronic components from that specific supplier.

When ordering samples online, 50% of engineers preferred ordering from the component manufacturer website. About 32% prefer an authorized distributor, and 5% of engineers said they never order samples.
When asked about the average size of their electronic component purchases over the past year as a result of receiving a sample from a supplier, 42% of engineers, which was the highest percentage, said they spent $0-$999. About 7% spent $25,000 or more over the past 12 months.
For more information, download the complete survey below.
Advertisement
Learn more about Electronic Products Magazine


