If properly understood, MTBF can be a significant tool for understanding datasheets
BY JOHN BENATTI
Astrodyne, Mansfield, MA
http://www.astrodyne.com
Mean time between failures (MTBF) may be one of the more familiar terms seen in datasheets, yet there is still a widespread misunderstanding of the term and its application. Consequently, some designers place too much emphasis on this parameter, others very little, and some have trudged through too many disparate datasheets to deem it any use at all. The truth is that the oft-maligned MTBF can indeed be helpful if one has a proper understanding of what it is and, maybe more important, what it is not.
To begin any discussion of a specification, it’s essential to answer the three questions:
How is the term defined?
How is it derived/calculated?
How can I use this information?
Definitions
In order to properly understand MTBF, it’s important to remember these key definitions.
MTBF. Mean time between failures is calculated in hours and is a prediction of a power supply’s reliability. MTBF = 1/λ (failure rate).
MTTF ( mean time to failure) may be substituted in some datasheets for units that will not be repaired.
Reliability is further defined as the probability that given a certain failure rate, that a certain number of units will pass (or fail) within a specified period.
Failure rate is the rate of product failures expressed as a function of time; λ = 1/MTBF. Failure rate is the central element that binds these terms. Its importance cannot be overstated. A common misconception is linked to a misunderstanding of failure rates as they apply to MTBF. Failure rate is expressed over time, and, more important, the reliability definition tells us that this time is designated within a specific, useful period. Not the entire life of the product. MTBF is often misquoted as life hours or service life and this is simply not the case. A quick study of failure rates and their relationship to MTBF will further illustrate this point.
Failure rates for all manufactured products can be characterized in the universal product reliability curve (or bathtub curve) seen in Fig. 1 .
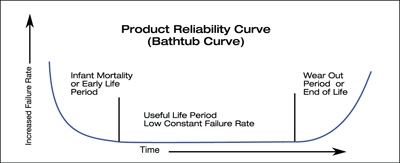
Fig. 1. Product reliability curve
The curve is an approximation of failure rates throughout the entire life of a product. Failures in the infant mortality or early period are generally comprised of poor workmanship or weak components and are usually screened out before hand. While this information may be helpful in the analysis of early failures it is not relevant to reliability predictions.
At the other end of the curve, the wearout or end of life period shows drastically increasing failures due to simultaneous component failures. This is beneficial in determining the true end of life for the product, but also not relevant to reliability information. So while both ends of the curve contain useful information, MTBF is primarily concerned with the “useful life” period where failure rates are relatively low and constant and where the strength of a design can be seen and meaningful comparisons made. The useful life period is the actual service life of a product. Its length is dictated by the end of the infant mortality period and the onset of high component failures in the wear out period. How reliable the product is between infant mortality and the end of life is the true measure of a part’s reliability (MTBF).
Now that all terms have been defined properly, the relationship between failure rates, predicted reliability, and MTBF can be summed up with the exponential formula
R(t) = e^ (t/MTBF),
where e = 2.718
The equation is used in this typical MTBF example:
Question: What is the predicted reliability for a unit that has a useful life of 5 years and an MTBF rating of 500,000 hours?
Answer:
R=2.718^ (8760*5/500,000) = 0.916
or 91.6% of the units will still be failure free. 8.4 % will have failed.
Methodology
Total population tracking through field data or field data measurement method is the most accurate way to determine reliability, and should be used whenever possible. Historical field data are desirable for its ability to unearth real world failures that cannot be anticipated by calculations or other means.
When field data are scarce or nonexistent, as in the case of new designs, then a predictability method should be used. There are several methods for predicting reliability. The length of this article will limit us to exploring only a few of the more common.
MIL HDBK 217
This handbook was first published in 1965 as a way to standardize reliability predictions. It is still used by many manufacturers to this day, and therefore can serve as useful tool for comparing one product to another. You will see this standard abbreviated as MIL-STD 217 or 217F (note 2). The standard contains two accepted methods for deriving reliability predictions.
Parts stress analysis prediction
The main concept of parts stress analysis states that a parts total failure rate can be found by summing up individual failure rates of each component. The individual failure rates themselves are found by multiplying assigned factors such as temperature, electrical, environmental stresses and others.
It is important to note that to properly assign the factors; the product must be very well understood in terms of its environment and intended use. A misapplication of factors will yield erroneous results. This method requires a high level of analysis and in products with many components can be rather time consuming, which brings us to the second prediction method of standard 217.
Parts count prediction
In this prediction, similar components are assigned a generic failure rate and then the numbers of components are multiplied to produce a group failure rate. If there are non-related parts, they must be calculated separately. The failure rates of all the different parts groups are then added for the total failure rate.
Telecordia reliability prediction model
Telecordia (formerly Bellcore) was formed as a telecom market revision of MIL-STD 217. In 1985, Bellcore Communications Research took many of the equations in MIL-STD 217 and made them more relevant to failure data from the telecom industry.
Currently the standard contains 217 calculation methods as well as the calculation methods specific to the telecom reliability model. The latest revision of the standard is SR-332 Issue 1, released in May, 2001.
Environmental factors
Just as important as the methods used are the assumptions that are made in MTBF calculations. These include operating temperature and environment. A typical MTBF parameter might be 500,000 HRS at 25°C, ground benign, where 25°C is the operating temperature. Ground benign is the environment (in many datasheets, ground benign is assumed and not listed).
Ground benign (Gb). Non-mobile equipment used in ideal environment. These would include laboratory, medical and test equipment, etc.
Ground fixed (Gf). Non-mobile equipment that is used in less than ideal environments, such as rack mount, instrumentation or equipment that is used in buildings without controlled temperatures.
Ground mobile (Gm). Equipment installed in any wheeled or tracked vehicle.
A quick look at these important factors gives us an insight into their impact on MTBF calculations as defined in MIL-STD 217 (see Figs. 2 and 3 ).
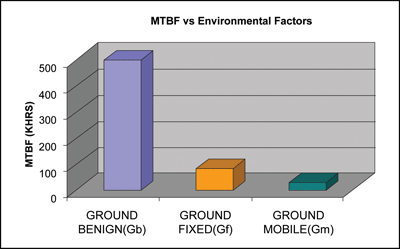
Fig. 2. Typical representation of environmental factors.
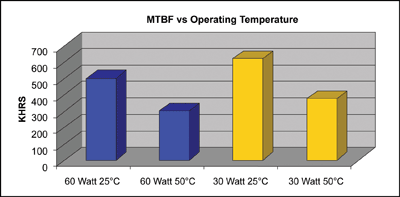
Fig. 3. Typical representation of operating temperatures and load.
Application
The application of MTBF is only relevant when the manufacturer’s methods and assumptions are understood in direct relation to the needs of the end user. While that notion is fairly intuitive, what is less clear is the matter of making reasonable comparisons between vendors. This is problematic given the sometimes strikingly different MTBF hours for similar parts under the same methodology and conditions. One can argue the point that the difference in numbers is caused by manipulation of data; and therefore not worthy of consideration, but the numbers bear a closer look.
Assuredly, there may be various degrees of interpretation or “specsmanship,” depending on your perspective, but the underlying fact is that for years commercial manufacturers have been applying their parts to a standard designed for mil-grade components. (Notwithstanding Telecordia, there has been little movement in tailoring these standards to specific markets.) This has left designers with somewhat fuzzy guidelines in the proper assignment of stress factors. Regrettably even small changes in those factors can greatly impact MTBF hours. The advent of software programs designed to calculate MTBF has greatly helped designers to lessen these disparities, but not all manufacturers use the same program, so there are still some differences in the resulting data
However, a fact that is not well understood is that most manufacturers take a very conservative approach to the tabulation and therefore actual field failure rates are generally lower than predicted reliability. Also less understood is that due to the exponential nature of the failure rate formula , MTBF hours during the same useful life period are not proportional and therefore not as dissimilar as they might seem. See the example in Fig. 4 . Often vendors are disqualified because the end user has wrongly assumed that half the MTBF means half the reliability.
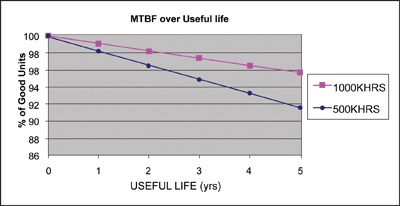
Fig. 4. MTBF calculated over useful life.
Even after all the variables are understood, there is still the concern of life hour limitations. Life hours for power supplies are primarily contingent upon electrolytic capacitors which usually do not last ten years. One surefire method to address life hours and boost MTBF is to employ a redundancy scheme (see Fig. 5 ). Two supplies are connected in parallel (through diodes) and each can support full load. If one were to fail, the other would take over until the failed unit can be replaced. Life hours are doubled and MTBF is raised to an extremely high level while down time is eliminated.
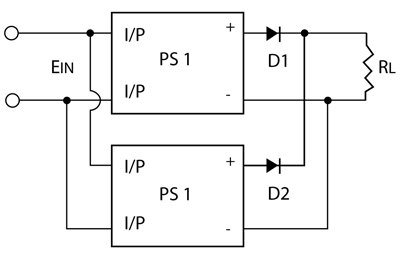
Fig. 5. Redundancy scheme.
Lastly, it is important to understand your vendor, not just their methods but also their company philosophy. Know what kind of approach they take to MTBF and to specifications in general. A qualified vendor should be able to explain the derivation of their MTBF numbers and be willing to answer all product questions. Competent vendors will stand behind their products and beside their customers throughout the application process. Predicting the reliability of the vendor is one prediction you should never have to make. ■
References
1. Skopal, Tom, “Power-Supply Failures Are Mostly Preventable,” Power Electronics Technology , August 2008.
2. Speaks, Scott, “Reliability and MTBF Overview”, VICOR.
3. “Reliability Prediction of Electronic Equipment,” MIL-HDBK-217F MILITARY HANDBOOK, December 1991.
Related Products: Power Supplies
Advertisement
Learn more about Astrodyne


