Simulate adaptive switching regulators using PSpice
The PSpice transient switching model can be effectively used to evaluate device behavior
BY JOHN RICE
Texas Instruments, Dallas, TX
http://www.ti.com
and
CHARLES HYMOWITZ
AEi Systems, Los Angeles, CA
http://www.aeng.com
The advantages of “constant-on time control” in switching regulators are well understood and include ultrafast transient response, a simplified control loop, and fewer external components. However, a principle drawback is that the switching frequency can vary with input voltage, output voltage, and the load making EMI less than deterministic.
Unlike conventional constant-on time controllers an adaptive on-time controller (such as Texas Instruments’ TPS51117 synchronous buck controller with D-Cap mode) adjusts the on-time in response to changes in line or load. As such, this controller achieves a relatively constant switching frequency while inheriting the merits of a constant-on time control. [1]
Correlating the EVM with simulated circuit behavior
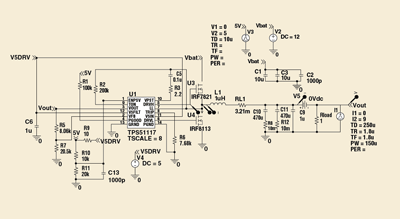
For our discussion we will use the OrCAD schematic illustrated in Fig. 1 a synchronous buck evaluation board module (EVM).

Fig. 1. Schematic of a buck converter 4.5 to 5.5-V VIN to 1.05-V output.

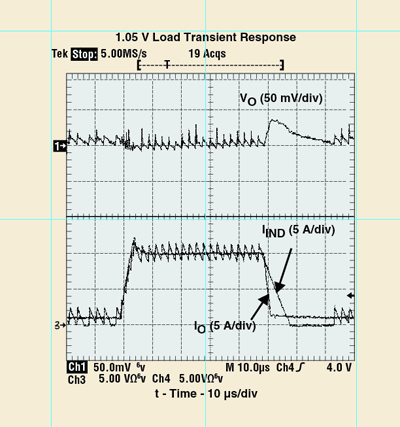
Fig. 2. Synchronous buck load step response; output voltage and load and inductor current.
Figure 2 illustrates how adaptive on-time control delivers exceptional output voltage transient response. Notice that turn-on output voltage disturbance is barely measurable while the 35-mV positive disturbance at turn-off is solely determined by the output filter response to a load step as expressed in:
Vover L I2 /(2 COUT VOUT )
Loop stability
The sufficient condition for stable operation is achieved by setting the 0-dB frequency below half the switching frequency, or more conservatively:
fo = 1/(2π ESR • COUT ) ≤ fsw/4
As f0 is determined solely by the output capacitor characteristics, loop stability is determined by capacitor chemistry. Given the above restriction, specialty polymer capacitors (SP-CAP) easily satisfy the above equation and are often selected.
PSpice simulation results
Modeling power supply operation requires knowledge of the system, the application’s circuit behavior, device physics, and, of course, PSpice. Built-in PSpice default models and those more advanced macro models in the accompanying libraries make creating an accurate representation of the circuit much easier. However, environmental conditions, parasitics associated with the particular layout and alternate component substitutions can alter the response. Therefore, these conditions must be considered in simulating a power supply’s response at various operating conditions. The behavior of each device model must be considered.
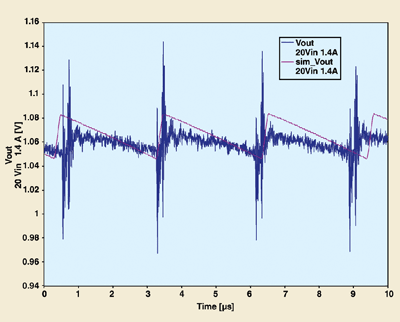
Take for example the output ripple behavior simulated in Fig. 3 . To achieve this level of agreement between simulation and empirical results requires accurate representation of the capacitor’s intrinsic ESR, along with careful bench measurement techniques. A capacitor datasheet rarely provides the kind of characterization needed to model a device accurately. Thus, the output capacitor should be carefully measured on an impedance analyzer to determine the intrinsic ESR at the desired operating point.

Fig. 3. Bench-tested output voltage (blue) overlaid with simulated output voltage (purple), VIN 20 V, IOUT 1.4 A.
Multimode operation and load-step response
The aforementioned simulation caveats are especially true with controllers that are dependent on external parasitic behavior. Having a PSpice model of the pulse width modulation (PWM) controller that can respond to these changes is extremely helpful in analyzing how the system responds to supply tolerances, load variations or component tolerances.
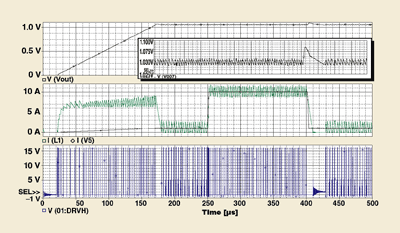
One of the most impressive characteristics of D-Cap mode is its ability to seamlessly transition from PWM mode to a lower loss, or pulse frequency modulation (PFM) mode of operation.In Fig. 4 , the controller is operating in PFM mode until a 5-A/µs load step to 10 A is applied. The high-gain comparator responses to the load change results in minimal output disturbance, which agrees with the bench and datasheet measurements.

Fig. 4. Output-voltage (step up and down) response to a 1.8 µs 0 to 9-A constant-current step load. VIN 5 V, VOUT 1.05 V. The switch node and inductor current are also shown, along with a close up version of the output voltage, which matches the data sheet response very closely. The TPS51117 PSpice model supports a parameterized time-accelerated soft-start feature to reach steady state faster, then transitions into a no-load condition. This saves a great deal of simulation time. While the model can simulate the full startup sequence, shortening the time to get to steady state is helpful when simulating line or load step events.In discontinuous conduction mode (DCM) mode, the switch node resonates at a frequency largely determined by the FET output capacitance and output inductor.
PSpice tips
• A capacitor can be modeled with varying levels of complexity. Models based on a C, CR, or RLC are all common with the resistance set to the ESR value at the frequency of interest. For steady state analyses, the ESR at the switching frequency is usually sufficient. However, for load and line step simulations, a broadband model with ESR accurate over several decades of frequency is often required. In this case a ladder type subcircuit model should be employed.
• The schedule option can be invoked on a number of parameters that control simulation accuracy and performance. The key to simulation speed is the iteration count, the number of time steps the simulator requires or is required to perform.
Breadboard-simulation tip
• When performing a simulation, make sure that the input line and output load impedances are comparable to those used in the bench. A constant-current load source and a resistive load can produce different results, especially in the frequency domain simulations. Line impedance including resistance and inductance should be modeled, especially if the leads from the power supply to the test board are more than a few feet.
References
1. Download this application note containing detailed information about the TPS51124 architecture, “Adaptive Constant On-Time (D-CAP) Control Study in Notebook Applications (Rev. B)”: www.ti.com/tps51124 slva281b-ca.
2. Panasonic web site, Capacitor Dielectrics: www.panasonic.com/industrial/components/capacitive/cap_spcap.htm.
3. An Improved SPICE Capacitor Model, Steven M. Sandler, AEi Systems, LLC: www.aeng.com/pdf/Capacitor.PDF.
4. SPICE Models of Capacitors, John Prymak, Kemet, Vol. 4, No. 5, September 1994.
5. New SPICE Models, John Prymak, Kemet, Vol. 8, No. 2, July 1998.
6. Find the TPS51117 Datasheet, User Guides, SPICE Models and other technical documents here: www.ti.com/tps51117-ca. ■
Advertisement
Learn more about AEi SystemsTexas Instruments


