BY DAVID WYBAN
Applications Engineer
Keithley Instruments
www.keithley.com
Once, power semiconductors were almost exclusively silicon. Today, however, power device manufacturers are increasingly turning to compound materials like silicon carbide (SiC) and gallium nitride (GaN) to create the next generation of high power semiconductors. These materials typically have much higher power density, smaller size, better high temperature performance, higher frequency response, lower leakage, and lower ON resistance than silicon, all of which add up to greater operating efficiency. In turn, devices based on SiC and GaN have far lower leakage than silicon, so at the same time as there is a need for sourcing higher voltages in testing, there is also a greater need for extended current measurement sensitivity.
When compared with traditional silicon, SiC, GaN, and other compound semiconductor materials are more difficult to work with and more difficult to control from a processing standpoint. Unfortunately, they also demand more from the systems needed to characterize and test them. Curve tracers were the industry standard for testing power semiconductor devices for many years and they’re still in use in many semiconductor makers’ labs today. However, few companies continue to make them, and even the ones still in service aren’t up to the task of testing modern power semiconductors, which have lower ON resistances (down to sub-milliohms) and leakage currents (just picoamps) than ever before.
Recently, however, test instrument manufacturers have introduced systems that combine the best of old-fashioned curve tracers with modern parametric characterization instruments. These new advanced-performance curve tracer (APCT) systems are designed to address the tougher testing requirements of high power semiconductors. To distinguish between APCT systems and traditional curve tracers, let’s examine the differences in their capabilities for output power, accuracy/resolution, and dynamic range.
Output power
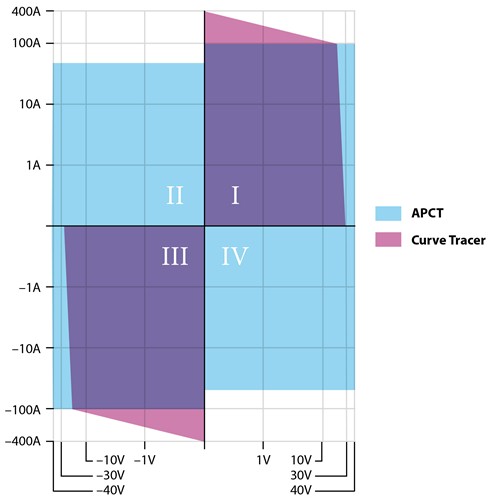
Both APCT systems and traditional curve tracers offer high output power capability. For ON state device characterization, a typical curve tracer can deliver up to 3000 W of output power from its high current collector/drain supply; a typical APCT can deliver up to 4000 W. However, there is a significant difference in the power envelopes of the high current collector/drain supply of both solutions (see Fig. 1 ).

Fig. 1: Comparison of the power envelopes of the high-current supplies in a
typical curve tracer and a typical advanced performance curve tracer. A similar
comparison applies for high-voltage supplies.
The maximum output voltage for the traditional curve tracer’s high current supply is 30 V, compared to 40 V for the APCT. The curve tracer can output up to 400 A but, due to the load line effect of the series resistor built into the supply’s output, it can only deliver 400 A if its output terminals are shorted. At higher voltages, the curve tracer’s maximum current is reduced; at 100 A, the curve tracer can only output up to 22.5 V. In contrast, the APCT can output up to 100 A at the 40-V maximum output voltage, which gives it greater characterization capability at voltages above 22.5 V.
Both the curve tracer and APCT also have a high voltage supply for testing power devices in the OFF state. A typical curve tracer’s high voltage collector/drain supply can output up to 3,000 V and up to 40 mA. However, like its high current supply, the curve tracer’s high voltage supply contains a series output resistor, so it can only reach the maximum current output when its output is shorted. For typical breakdown and leakage testing, this isn’t a problem because the measured currents are very small (typically less than ten microamps and often as low as hundreds of picoamps), so the drop across this resistor will be minimal. A typical APCT’s high voltage supply can also output up to 3,000 V at up to 20 mA. If the test requires less voltage, the APCT’s high-voltage supply can output up to 120 mA at up to 1,500 V. This ability to source higher currents at high voltages expands the APCT’s capabilities to handle tests such as ON-state breakdown. This capability is essential for the next generation of power semiconductors designed for high-power applications.
Accuracy and resolution
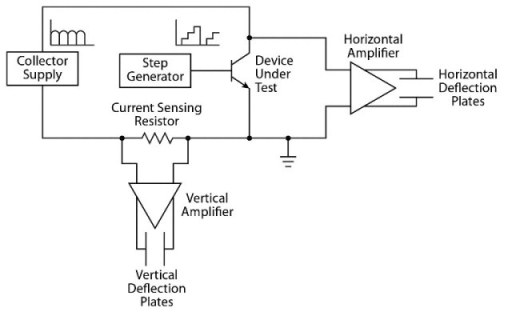
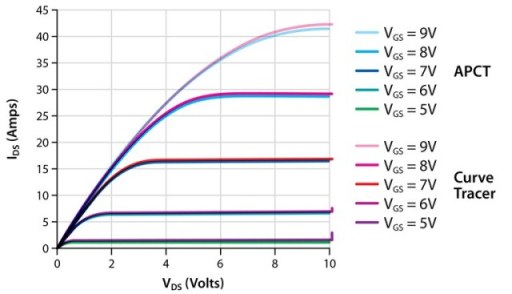
A typical APCT such as a Keithley Instruments’ Parametric Curve Tracer Configuration employs high-accuracy, 6-1/2-digit source measurement units (SMUs) for sourcing and measuring test signals. The measurement circuitry in traditional curve tracers consists of amplifiers that measure the signals from the DUT and amplify them to obtain a voltage that is then applied to the CRT’s deflector plates (Fig. 2 ). The effect of these differences can be seen in Fig. 3 for an n-channel MOSFET device’s set of characteristic I-V curves taken with both a curve tracer and an APCT.

Fig 2: Simplfied block diagram of a typical curve tracer's measurement
circuitry.

Fig. 3: Characteristic I-V curves for an n-channel MOSFET taken with a curve
tracer and an advanced performance curve trac er.
Even though both systems tested exactly the same device, the data does not correlate as well as might be expected. For the top-most pair of curves where the gate voltage was 9 V (VGS = 9 V), the drain current (IDS) at a drain voltage (VDS) of 10 V differed between the two systems by more than 800 mA. At this point on the curve, the IDS reading from the curve tracer is 42.25 A. Based on the curve tracer’s accuracy specification, we can calculate the accuracy of its IDS measurement at this level to be only 1.13 A:
1.5% of Reading + 0.1 * Current Per Division Setting = 0.015 *42.25 A + 0.1 *5 A = 1.13 A
For the APCT, the SMU used in this test has a specified accuracy of 0.05% of reading plus 50 mA. With a measured current of 41.41785 A, the accuracy of the APCT is:
0.0005 * 41.41785A + 50 mA = 70.7 mA
In other words, the curves generated by the curve tracer and the APCT could differ by as much as 1.2A, and the readings would still be within the two systems' specifications. Based on the specifications of the two systems, in this example the APCT is more than 15 times more accurate than the curve tracer.
This test was performed at more than 80% of full scale. At smaller scales, the APCT’s accuracy advantage is even greater. With 10 to 100 times greater accuracy and 1,000 times better resolution, the APCT allows much higher measurement confidence than a curve tracer. This confidence is essential for GaN and SiC semiconductor testing because leakage currents less than one nanoamp must be reliably measured.
Dynamic range
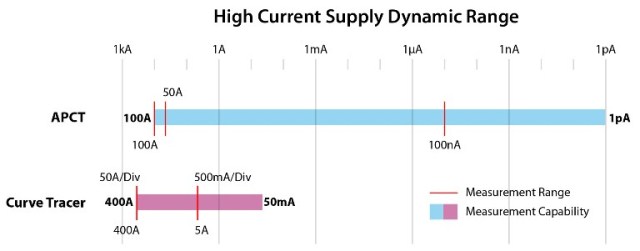
Both a curve tracer and an APCT can source and measure high levels of current for characterizing the ON state of power semiconductor devices. However, only the APCT also has the wide dynamic range necessary to measure the very small currents found in the OFF state and near the threshold voltages of these devices (see Fig. 4 ).

Fig. 4: Dynamic range of the high current supply of a typical curve tracer and a
typical advanced performance curve tracer. The range lines indicate only the
highest and lowest ranges; ranges in between have been left out for clarity.
This dynamic range chart illustrates that, although the curve tracer can cover approximately four decades of current resolution (from 50 mA to 400 A), the APCT can cover 14 decades of current resolution (from 1 pA to 100 A). This huge dynamic range for the APCT's high-current supply gives the APCT greater ON-state device characterization capability. The APCT also offers a similarly broad high voltage supply dynamic range.
Advertisement
Learn more about Keithley Instruments


