Introduction
Four broad trends are changing operating conditions on electric-power distribution grids, and thus increasing stress on distribution infrastructure:
1.Energy-use preferences have been shifting toward electric power, resulting in electricity-use growth rates, which are twice that of other energy sources.
2.Aging distribution equipment is now on average older than its manufacturers' recommended operating lifetimes.
3.Increasing use of electronic loads reduces load power factors and decreases grid utilization efficiency.
4.Distribution grids are no longer static one-way power delivery systems, but are now dynamic two-way links that also connect distributed generation resources to loads.
To accommodate changing use models and improve reliability smart powerline monitors are necessary for utilities to track dynamic operating conditions on distribution grids. Let's take a closer look.
Challenges for the Grid
Structurally, distribution grids have changed little over the past century. They developed to service comparatively modest, linear loads over moderate distances. Until a few decades ago, that model was a realistic characterization of distribution grids' operating conditions.
For the last several decades, however, electric-power use has been changing. According to IEC® (International Energy Agency) estimates, worldwide electricity demand rose from 5.1PWh to 17.9PWh (1015 Wh) between 1973 and 2010.1 Although electric-energy use more than tripled over 37 years, it represents only a 3.44% compound annual growth rate (CAGR). It is also more than double the CAGR of overall energy use, 1.69%, and of global population, 1.54%.
During the same time, most monitoring-technology deployments happened at generation and transmission facilities, with monitoring on the distribution grid limited to the head end at the substation. Historical use models allowed utilities to assume correctly that measurements at substations reflected operating conditions throughout the distribution grid. This assumption, however, is in fact less valid because actual grid use has become more complex.
Upgrading the distribution infrastructure is expensive. According to a study commissioned by the EEI (Edison Electric Institute), the cost for newly constructed overhead distribution lines ranges from $86,700 to $1,000,000 (U.S. $) per mile, depending on the locale and population density.3 Costs for newly constructed underground distribution lines are more than three times those for overhead wires. Utilities are, therefore, eager to squeeze as much use from existing distribution grids as they can.
In addition to the three-fold increase of electric-power use in absolute terms, the nature of power loads has changed over the same period in ways that affect grid capacity. Electric-power generation and use are measured and billed in energy terms—the kWh. Utilities assess their distribution capacity, however, in terms of current.
Customers pay for real power—the instantaneous product of the voltage and current waveforms. Nonresistive loads present current waveforms that are not strictly in phase with the voltage waveform. In such cases, one can separate the current waveform into the real or in-phase component and the reactive or quadrature-phase component. The load extracts useful work from the real component of the current waveform, but the utility must provide the total current.
Power factor is a measure of real power, as a fraction of the sum of real and reactive power. Even a power factor as high as 0.9 accounts for up to 11% excess grid utilization over and above that for which the power provider can charge residential and most commercial customers (Figure 1). Although electronics manufacturers have been improving their products' power-factor performance, a large amount of legacy equipment is still in service with power factors as poor as 0.55, corresponding to 82% excess grid utilization (Table 1).
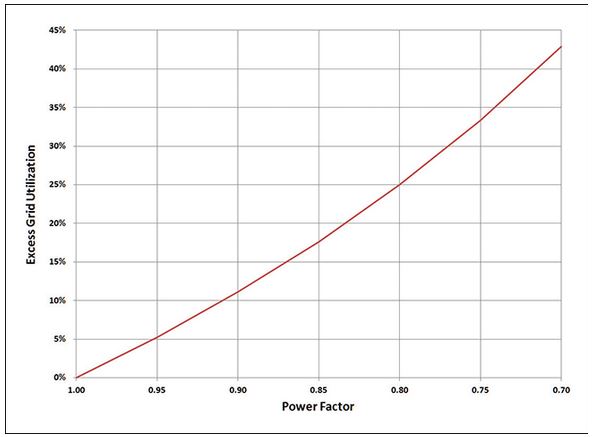 Figure 1. A power factor less than 1.0 forces the utility to provide current in excess of that warranted by the useful power it delivers to a load. Data and graph used with permission from JAS Technical Media ©2013.

Much of the energy-use growth during the last several decades has been due to the penetration of electronic (as distinct from electric) devices, which present nonlinear loads to the grid. Nonlinear loads generate current-waveform harmonics, which also degrade power factor and drive up excess grid utilization. Various agencies and standards organizations set limits on the harmonic content of current waveforms, typically counting the first 40 to 50 harmonics corresponding to 2kHz to 3kHz measurement bandwidths depending on the controlling norm and locale.
Among the various user sectors, transportation has historically represented a small fraction of the total load on distribution grids (Figure 2).5 In percentage terms, transportation represents a smaller fraction of total global electric-energy use, but in absolute terms, the sector has more than doubled (Table 2).
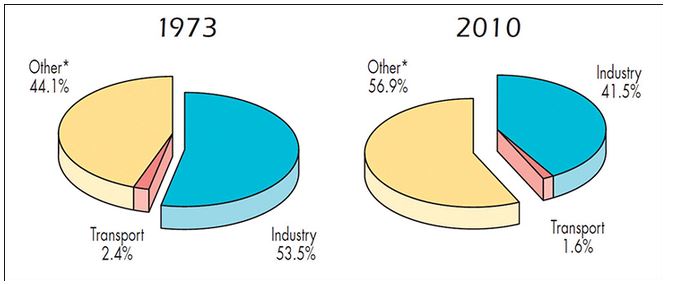
Figure 2. Although the transportation sector's percentage use of electric power decreased on a worldwide basis between 1973 and 2010, in absolute terms the sector's power usage more than doubled during the same period. Adoption of plug-in EV and HEV passenger vehicles is expected to accelerate the growth of this sector during the current decade. Source: Key World Energy Statistics 2012 © OECD/IEA, 2012, p.35.

In the U.S. the transportation sector's electric power use is set to grow faster than the historic organic rate due, in part, to a 2011 White House initiative with the goal of one million cumulative electric passenger vehicles (EVs) by 2015.7 Meanwhile, sales of hybrid-electric vehicles (HEVs) have grown to almost 3% of the annual 12-million vehicle U.S. market, and interest is growing in the plug-in versions of these vehicles.
EV and HEV adoption, however, has not homogeneously distributed across the entire country. Rather sales have tended to cluster in 24 metropolitan areas so their affect on grid-power demand will be greater in some geographies early in their adoption.8 One motivator for vehicle owners to switch to EVs or plug-in HEVs is the cost disparity between regular gasoline and the so-called eGallon—the cost of the electric-energy equivalent to a gallon of regular gasoline: The U.S. average price for a gallon of regular gasoline in August 2013 was $3.56 compared to $1.22 for an eGallon.
Finally, distributed generation and especially small-to medium-scale renewables are changing the distribution grid from a static, one-way power-delivery structure to a more complex and dynamic two-way system. In particular, customer-based photovoltaic and small-scale wind generation pushes power back onto the distribution grid when their power generation exceeds the customer's immediate use and, if present, local storage capacity. Moderate-sized customer-owned photovoltaic sites, such as those appearing on the rooftops of office buildings and parking structures, can generate over 500kW and supply more than 250MWh annually. During low-use periods, such as weekends, these facilities can push excess energy back onto the distribution grid.
With the distribution grid's historic operating model, utilities have struggled to detect and respond to a variety of grid conditions, such as voltages at the grid edge from distributed generators.
The High Cost of Failure
The annual economic consequences of electric power reliability events (i.e., power failures) to U.S. power-utility customers is about $79 billion according to the Lawrence Berkeley National Laboratory base-case estimate.10 Of this amount, about 2/3 is attributable to momentary service interruptions—those lasting less than five minutes. The duration for the remainder can extend from minutes to days. Loss figures do not include investments in power-failure mitigation equipment such as customer-owned backup generation, batteries, or power-conditioning equipment to moderate power-quality events.
In addition to their own financial motivations, electric-power utilities are under pressure from customers, industry organizations, and regulatory agencies to minimize reliability events. Powerline monitors throughout the distribution grid can operate in concert with automated switchgear to quickly identify anomalous operating conditions, route around affected areas, and expedite problem resolution.
Beyond asset management, monitoring valuable infrastructure components such as branch reclosers and secondary transformers is integral to fast-acting protection methods. Monitoring can also provide valuable data from the distribution grid's edge. Deployment of powerline monitoring at the secondary-transformer level is in its early stages, but is projected to exceed the traditional power-transformer market by 2015 (Figure 3).12 This development is possible, in part, due to the availability of analog and mixed-signal IC components that greatly simplify the task.
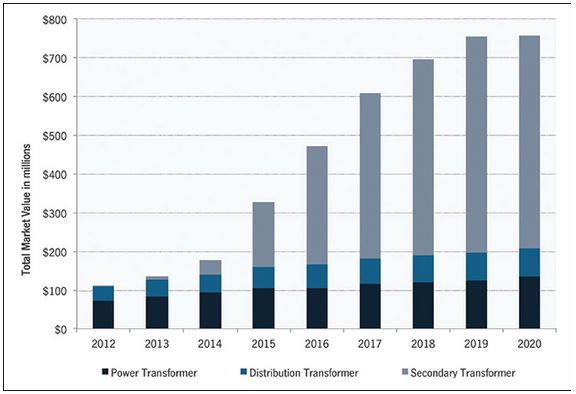
Figure 3. Secondary-transformer monitoring is on track for rapid growth, exceeding generator-power- and distribution-substation-transformer monitoring by 2015. Data and chart used with permission from GTM Research.
Smart Monitoring
Powerline monitors located in the distribution grid are topologically similar to those at the substation and elsewhere in the electric-power delivery system. Voltage transformers provide scaled representations of the voltage on each of the three power phases and on the neutral. Similarly, current transformers provide a voltage representation of the current passing through each of the three power phases and neutral. The monitor's analog front-end (AFE) electronics can buffer the eight resulting signals and filter them to ensure that out-of-band (OOB) energy does not alias down to the baseband during the digitization process (Figure 4).
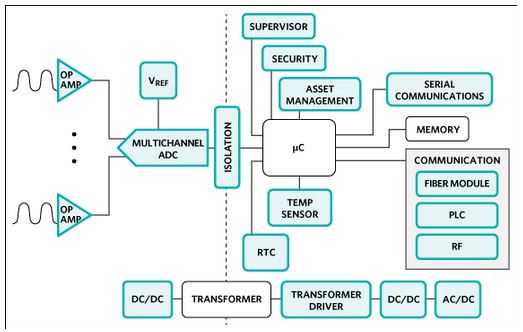 Figure 4. Analog and mixed-signal ICs simplify the power-monitor design task. As the shaded regions indicate in this diagram of potential and current (PT/CT) transformers, most of the necessary functions are available from Maxim Integrated.
In common wye-connected distribution systems, the utility drives the three phases with 120° offset between pairs; voltages are measured with reference to a fourth neutral lead. Under balanced load conditions, 100% of the current flows through the phase connections. Current flowing through the neutral signifies an imbalance. Such an imbalance could indicate, for example, an emerging defect in a secondary transformer's insulation system, thereby providing the utility with advanced warning and allowing them to replace the transformer on a schedule. Such edge information gathering saves both the utility the cost of an emergency response and saves the customer the cost and inconvenience of an unanticipated field failure.
Calculating the power over one line cycle requires accurate and simultaneous measurement of both the voltage and current signals for each phase and the neutral. For each lead, the monitor must compute: 
Where v(θ) is the instantaneous voltage at cycle phase θ, and i(θ) is the instantaneous current. The monitor can compute reactive power by multiplying the RMS values of voltage and current and subtracting the real component.
The European Union's IEC 62053 standard for Class 0.2 equipment typifies requirements for power monitors, It calls for measurement error ≤ 0.2% of the nominal voltage and current. Power-factor measurement requires phase matching voltage and current samples to ≤ 0.1%.
Such measurement specifications require that the eight digitizers required for a three-phase line closely match one another and that their sampling times are tightly controlled. Analog and mixed-signal IC makers such as Maxim Integrated provide 4-channel analog-to-digital converters (ADCs), such as the MAX11040K, well suited to these measurements. The ADCs' differential inputs and control features allow groupings of up to 32 channels of simultaneous sampling. Integrated 8-channel ADCs, like the MAX11046, are also available for monitoring applications that can use single-ended inputs.
Data from a line's eight voltage and current samples can feed a microcontroller or digital signal processor (DSP) to provide accurate power calculations and assessment of power factor. Systems can use the power factor data to control local capacitor banks and thereby improve overall grid utilization. Protection devices can use the power data for fast-acting automated breakers. Such systems can not only use the data to quickly open a breaker in the event of a sufficiently large line anomaly, but can also use the same data stream to close the breaker, minimizing the duration of the downstream power interruption.
Advertisement
Learn more about Maxim Integrated


