BY LORENZO CIVIDINO,
Director Field Technical Support
SL Power Electronics
www.slpower.com
Lighting technology has changed significantly in recent years after a century of little to modest advancements. The incandescent light bulb has served its purpose well, providing illumination albeit while also expending energy in the form of heat. High intensity discharge and fluorescent lighting made some improvements in efficiency and also to some extent product life. Compact fluorescent lighting (CFL) has promised high efficiency and long life. While the power consumption of CFLs is considerably less than that of incandescent lamps, their reliability for targeted product life has been less than stellar. One of the reasons for such shorter product life is the reliability of the electronic components and manufacturing processes needed to achieve the size and cost reduction of the CFLs. Fortunately, LED luminaires offer even more advancement in lower power consumption and expected life. However, if attention is not paid to the drivers and power supplies used to power LEDs, this new technology will also lower the life and reliability expectations.
MTBF and product life time
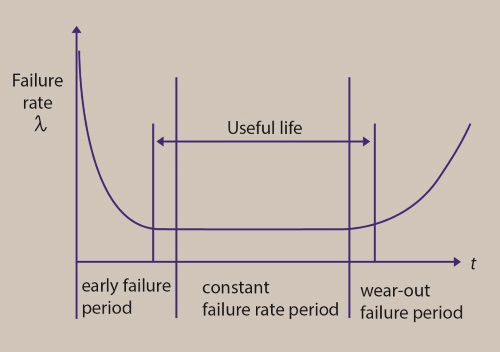
Product reliability is often evaluated in two ways; failure rate and product service life. However, there is no direct correlation between service life and failure rate. Product reliability deals with the statistical predication of the failure rate of a product or component during its useful life period. Its service life is often determined by wear-out mechanisms that have more to do with design, component selection, use model and its environment. A product’s reliability and failure rate can be depicted by the Weibull composite curves(see Fig. 1 ) for Infant Mortality (decreasing failure rate during initial product introduction), Normal Life (Constant, low failure rate) and End-Of-Life wear-out (increasing failure rate).

Fig. 1: Bath Tub curve constructed from composite Weibull Distribution for failure rates during a product use life cycle.
Product reliability is defined in terms of mean time between failure (MTBF) and expressed in hours. MTBF calculations are valid during the product’s useful life cycle. However, these two concepts, reliability and product life time, are often confused. For example, the light bulb may have an MTBF of 50,000 hours or power supply of 100,000 to 200,000 hours. By expressing that in years, (100 kHR = 11.42 years), one may think a product has approximately an 11-year life. In fact, there is no information in an MTBF estimate that says anything about a product life. An analogy is to think of an automobile’s tire. It may be rated for 60,000 miles, but normally we don’t expect a failure during this time. This indicated a high MTBF beyond that numerically, of its service life. There are random tire failures, however, due to road hazards, defects in material and workmanship that can cause a tire to fail prior to its wear-out. But once we’ve exceeded the tire’s life, we expect it will blow out as the treads wear down and the tire loses it strength.
What do reliability and failure rates have in common? Temperature impacts them both in the same manner. Increased temperature increases failure rate (lowers MTBF) and lowers product life.
Temperature and failure rate
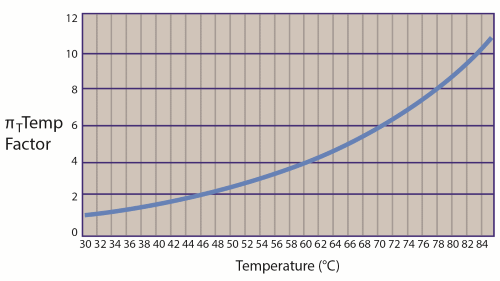
Temperature increases failure rate. The expression below shows the temperature factor as a function of temperature with respect to 30°C. It is a non-linear function of temperature and clearly shows the dramatic impact temperature has on component failure rates. For example, operating at a 40°C vs 30°C shows the failure rate is 1.6 times higher.
Temperature factors, ∏T are derived by the following expression:

Where
T0 = Reference temperature in degrees Kelvin
T1 = Operating temperature in Kelvin (°C + 273)
Ea = activation energy, varies from 0.05 ~ 0.70, use 0.40 for electrolytic capacitors and discrete semiconductors .
K = Boltzman constant = 8.62 x 10⁻⁵
The curve in Fig. 2 plots the temperature factor for failure rate. It can be used to determine the failure rate difference when comparing operating temperature conditions. For example, at 70°C, ∏T = 6.0. If you were able to reduce the operating temperature to 60°C, ∏T = 4.0, your failure rate would drop to 66.7% of that at 70°C. Keep in mind product failure rate is a function of many variables, but the point here is to illustrate the significant impact of reducing temperature of components.

Fig. 2: Plot of failure rate vs. temperature typical for electrolytic capacitors and power semiconductors.
Power supply efficiency
Power conversion efficiency is an important parameter when selecting a power supply for a number of reasons. The higher the efficiency, the lower the operating cost. More importantly, the lower the power losses are in the power supply, less heat is needed to be removed from the equipment. The additional losses of a lower efficiency power supply have a twofold impact. First, the additional losses increase the operating temperature and this increases the failure rate, but also reduces the product’s useful life. Both MBTF and product life expectancy are negatively impacted by increased temperature. These are two coupled but independent mechanisms. For power supplies, the main life-limiting components are electrolytic capacitors, fans, and to a lesser extent opto couplers. However, all the components are affected by increased temperatures when it comes to random failures as determined by MTBF calculations.
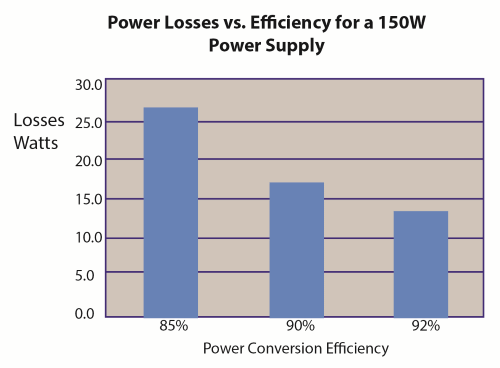
The impact of power conversion efficiency cannot be emphasized enough especially for LED lighting applications. The LEDs are somewhat thermally decoupled from the power supply and consume the majority of the power from the power supply. The power supply is in its own enclosure with perhaps the LED drivers. These are often sealed enclosures exposed to the elements and high ambient temperatures. Cooling is often achieved by conduction and convection cooling. So the power losses from the power supply become the dominant source of heat that raises internal temperature. As an example, Fig. 3 shows the power losses for different power supplies: one with 85% efficiency, a second with 90%, and a third with 92%. Although the 5% difference in efficiency may not seem as important, the better comparison is power loss. The more efficient product has 37% lower losses. Considering the increased internal temperature due to the higher losses of the less efficient product, the reliability and expected life of the more efficient product will be significantly higher.

Fig. 3: Power Efficiency Power Loss Comparison.
Electrolytic capacitor life
To continue with the analysis of power losses and impact on product expected life, knowing the impact of increased temperature on the life-limiting components is essential. The lifetime of non-solid aluminum electrolytic capacitors is generally expressed using three factors impacting component life; temperature, voltage stress, and ripple current stress.
Lx = Lo ∙ Ktemp ∙ Kvoltage ∙ Kripple
Where: Lx = Lifetime of the capacitor to be estimated
Lo = Base Lifetime of capacitor
Ktemp = component ambient temperature acceleration term
Kvoltage = Voltage acceleration term (Voltage stress usually has little impact on life at ~ 1)
Kripple = Ripple current acceleration term, (ripple current increases internal capacitor temperature)
The failure mechanism of electrolytic capacitors is the loss of capacitance and increased equivalent series resistance (ESR) as the electrolyte eventually seeps out through the end seal of the capacitor. Temperature accelerates this process and the following expression has been experimentally determined to express the relationship between temperature acceleration factor and deterioration of the capacitor[i].
Lx = Lo Ktemp = Lo B(To –Tx)/10
B = Temperature acceleration factor ≈ 2
To = Manufactures Maximum rated temperature for the selected capacitor (°C)
Tx = Actual ambient temperature of the capacitor (°C)

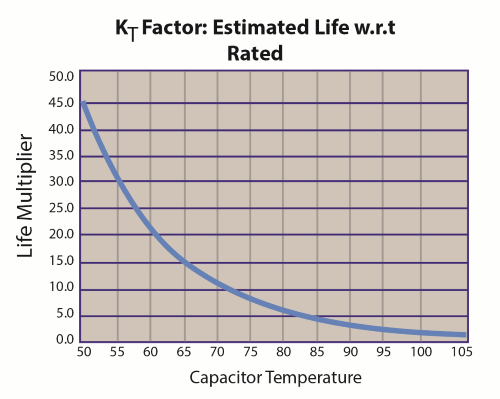
Fig. 4: Electrolytic capacitor life estimate; Life Factor as a function of capacitor temperature.
Based on a 105°C rated capacitor, at its 105°C rated operating temperature and base life, KT Factor = 1. At 70°C, KT Factor is = 11.3, so for a 5,000 hour rated capacitor operating at 70°C, its rated life is 65,500 hours ~ 6.4 years. As we can see, the life of the capacitor is significantly impacted by its operating temperature. For products requiring long operating life, long life (5,000 – 10,000 hours) rated capacitor are recommended as well as reducing the component operating temperature as much as possible.
LED luminaires are gaining acceptance in the market place due to their lower operating costs and anticipated extended operating life (> 50,000). Although LEDs have an expected long operating life, the drivers and power supplies powering the LEDs also have life limiting components and random failures typical of electronic equipment. The reliability of the luminaire can be enhanced by using high quality components and manufacturing processes. Furthermore, product life and reliability can be significantly enhanced by using high efficiency power supplies and good thermal design to lower component temperatures. Particular attention should be given to the life-limiting components such as electrolytic capacitors.
[1] Reliability Basics, Characteristics of the Weibull Distribution, Weibull.com, Hotwire Issue 14, April 2002.
[2] Telcordia Technologies, Reliability Prediction Procedure for Electronic Equipment, SR-332 May 2001.
[3] Nippon Chemi-Con Aluminum Electrolytic Capacitors, 2008
Advertisement
Learn more about SL Power


