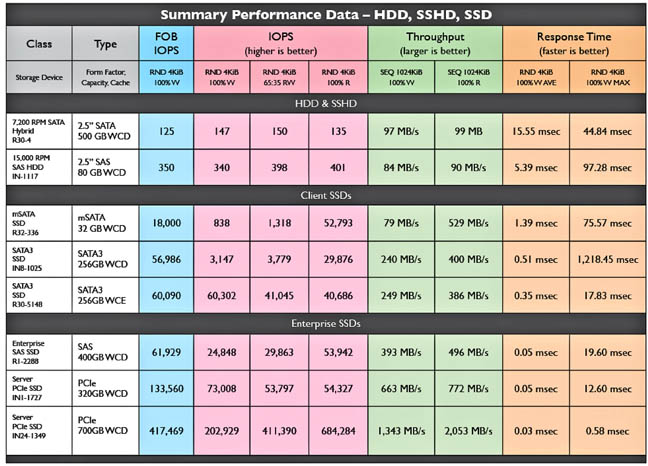
At the recent Flash Memory Summit in Santa Clara, Calypso Systems (https://calypsotesters.com) showed their Summary Performance Comparison chart for SSDs. If you find the various options for SSDs a bit confusing these days, this may be very interesting. The measurements were taken by Calypso Systems on the SSSI RTP/CTS test platform pursuant to SNIA Solid State Storage Performance Test Specification version 1.1.

Figure 1: The Summary Performance Comparison chart by Calypso Systems & published by SNIA SSSI
As noted by Calypso, much industry effort has been expended to define SSD Performance, and more specifically, the settling of performance metrics over time and use. However, SSD marketing claims of “Up to XXX IOPS…” or “Sustained IOPS of XXX” continue to permeate the industry. Marketing claims are for “fresh-out-of-box” (or “FOB”, column 3) performance. The FOB metric is extremely transitory (out run in a matter of minutes or a few GB of writes). Further, FOB IOPS are a “peak” value which is not achieved after garbage collection and TRIM. At best, IOPS performance will achieve only some portion of the initial FOB IOPS measured immediately after a purge of the SSD.
The chart shows test results for a 15,000 RPM SAS (Serial Attached SCSI) hard disk drive (2nd data row) and a 7,200 RPM hybrid drive (1st data row), along with results for various types of SSDs. The HDD and SSHD drives show lower performance, with no difference between FOB and steady state. For the SSDs, the FOB column shows a higher level of performance followed by lower level during steady state measurements. For SSDs, FOB IOPS shows the test starting point as well as the peak IOPS value that SSD advertisers may claim.
The IOPS, TP and LAT measurements show Steady State performance after the SSD has been pre-conditioned and written to steady state. General performance increases from mSATA through SATA, SAS and ending with the highest performance PCIe SSD listed. The three IOPS columns show write, combination W/R, and read numbers. Some manufactures claim that other maker’s drives can have fast read only and fast write only numbers, but fall down when switching between the two. This is not show by this data. Note the mSATA type drives exhibit very fast read performance, but very slow writes – just fine for some applications.
Note the max response time spike for the write cache disabled (WCD) SATA3 SSD. Note also the improved random 4 KiB IOPS values when write cache is enabled (WCE) in the next row.
The M.2 type drives are not referenced on this chart. But they use SATA-3 6 Gbit/s, so should be the same as drives listed here, I guess.
A lot more information can be obtained at this site: http://www.snia.org/sites/default/files/SNIASSSI.SSDPerformance-APrimer2013.pdf
Advertisement
Learn more about Electronic Products Magazine


