BY SAMANTHA MOREHEAD, Santa Clara University,
AND MOHAMED ISMAIL, Senior Member of the Technical Staff, Applications
Maxim Integrated
www.maximintegrated.com
I love taking my dog, Mocha (Fig. 1 ), on hikes with me on the weekends, and she often likes to run ahead of me and do some off-trail exploring. She always finds me again, but sometimes long after I am ready to leave. I wanted to find a way to easily track her location. While browsing the Adafruit website one day, I came across their GPS Logging Dog Harness project. The project uses Adafruit’s sewable microcontroller platform called FLORA and a GPS module to track a dog’s location, and I thought that this would be a great way to monitor my dog’s activity while we go hiking. With my colleague, Mohamed Ismail, I embarked on an experiment.

Fig. 1: Samantha’s dog, Mocha, ready for a hike.
For our original design, we used the FLORA and the GPS module, along with an ISM transmitter (MAX1472) to broadcast the GPS coordinates. We also used four FLORA RGB Smart NeoPixels to make Mocha more visible during night hikes. In addition, we used the NeoPixels to indicate the remaining charge of the battery so we would know when to get my leash before the system shuts down. We used green to represent a charge of 50% or above, yellow to represent a charge between 50% and 25%, and red to represent a charge of 25% or less. Fig. 2 shows our dog-tracking system prototype.
![]()
Fig. 2: Wearable dog tracker system.
Almost everything in our original project worked perfectly — we were able to get GPS coordinates, flash the NeoPixels’ different colors, and broadcast coordinates with our ISM transmitter. The only part of our project that did not work as expected was our method of monitoring the battery state of charge (SOC). To estimate SOC, we used a straight-line approximation based on the measured battery voltage while the project was running. We found that NeoPixels were not red for 25% of the total runtime, but instead, they were only red for 9% of the total runtime. It was frustrating that we weren’t getting an accurate SOC from the current system, so we decided to do some investigating into different methods of determining battery SOC to find out which method is the most accurate.
Voltage divider versus fuel gauge IC
One very simple approach to determine a battery’s charge is to measure the voltage across the battery. On the Adafruit FLORA platform, a voltage divider (Fig. 3 ) is connected to an ADC input of the on-board microcontroller. This allows users to take an ADC reading and calculate the battery voltage at its terminals. Based on the battery’s characteristics and shut-down voltage of the system, the terminal voltage was used to estimate the remaining charge of the battery.
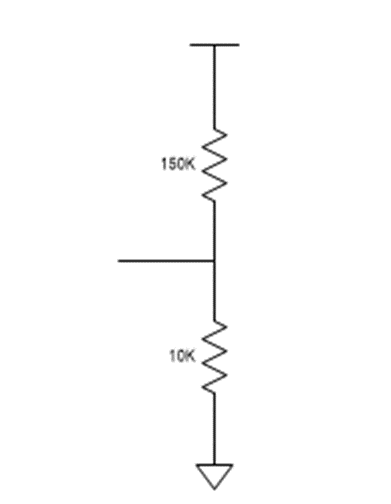
Fig. 3: Voltage divider used to determine battery charge on the Adafruit FLORA.
One major drawback of this method for calculating SOC is that it often produces inconsistent readings. A battery’s terminal voltage is dependent on SOC, but it’s also dependent on load current, temperature, and age. Any variations in these three parameters can lead to inaccurate results. If the load current changes or the temperature of the battery deviates, estimating battery SOC based on a simple resistor divider loses its accuracy. Our original design had a constantly pulsing load and was meant for the outdoors, which made for a very misleading battery life indicator.
One alternative to the voltage divider method is to use a fuel gauge IC. Fuel-gauging methods are very complex and, therefore, more expensive; however, the accuracy that they promise makes them quite attractive. The total resistance of the resistor divider on the FLORA is 160 kΩ, which means that it consumes ~23 µA when connected to a Li+ battery. We were hesitant to replace the resistor dividers with something that consumed more power, but Maxim offers a fuel gauge IC that claims to use only 7 µA of current! The MAX17055 uses Maxim’s fuel gauge algorithm called ModelGauge m5, which combines the two most common methods of fuel gauging — coulomb counting and open-circuit voltage measurement — to report the SOC of a battery with 1% error. Another innovative feature of the ModelGauge m5 technology is that it includes an EZ config feature that eliminates the need for battery characterization. This allows you to easily integrate the chip into your design without the complex task of battery characterization that most fuel gauge ICs require.
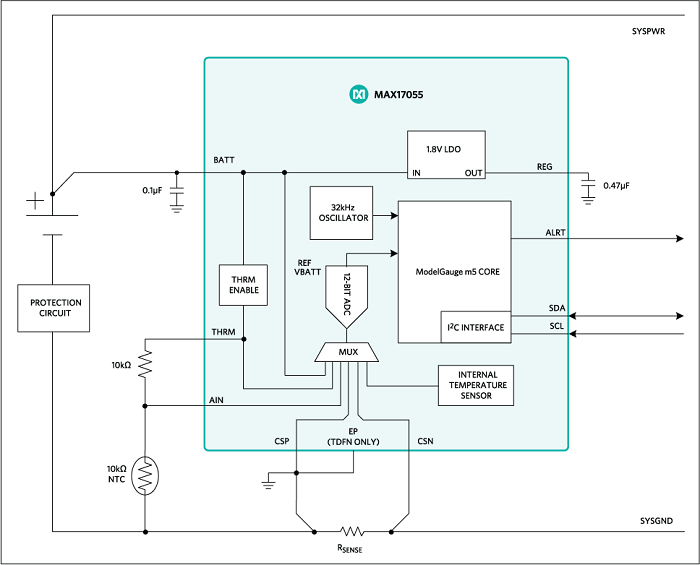
Fig. 4: Maxim’s MAX17055 fuel gauge IC utilizes ModelGauge m5 technology to determine battery charge.
Comparison tests
To compare the original voltage divider on the FLORA to Maxim’s fuel gauge IC, we performed a series of tests. After taking the resistor divider measurements, we replaced the components with the MAX17055. We used one 150-mAh battery for all tests to keep the results of each test consistent. First, we performed a baseline test by discharging the battery with a constant load, observing both the results of the voltage divider and the fuel gauge. Next, we used a more realistic, pulsing load to discharge the battery and observed the accuracy of the voltage divider and the fuel gauge.
Baseline test using resistor divider
The output of the voltage divider on the FLORA simply helps you determine the terminal voltage of the battery; therefore, some calculations must be done to translate the voltage reading to a percent charge that is easy to understand. First, we used a constant load of 125 mA to completely discharge the battery. The battery voltage was reported at constant time intervals. Fig. 5 shows the average cell voltage of five discharge cycles as the battery is discharged completely. Two different methods were then used to determine the SOC of the battery during discharge from the output of the voltage divider.

Fig. 5: Average cell voltage of a battery over time as it is discharged with a constant current load.
The first method was to correlate the voltage of the battery to some percentage of charge remaining. The 150-mAh battery used for testing can be charged to a maximum of 4.2 V, so this voltage was correlated to 100% charged. The minimum discharge voltage of the battery is 3.0 V, so this voltage was correlated to 0% charged. From these two estimations, a linear equation can be used to transform the battery cell voltage reported from the voltage divider on the FLORA to an approximate percentage of charge remaining. We’ve called this our “linear” approximation method. Although it is easy to form a relationship between battery cell voltage and SOC, it is not very accurate because, as seen in Fig. 5 , the battery cell voltage does not decrease linearly during discharge.
The next method is based on charge consumed by measuring the discharge time of the battery. With a constant load current, the amount of time passed is proportional to the amount of charge consumed (coulomb/second * second = coulombs); hence, SOC (coulombs). In this case, 100% charge is correlated to the start time of the test, when the load is first placed on the battery. Zero percent charge is correlated to time when the device shuts down. To form an accurate model using this method, we found an average of five discharge tests. From there, we created a fourth-order trendline for the average SOC. A higher-order polynomial would become impractical to compute for every battery voltage sample. The equation of this trendline was used to correlate battery voltage to SOC. The solid line in Fig. 6 shows the average SOC curve, while the dotted line represents the trendline. We call this our “polynomial” approximation method, and the equation for the trendline is shown in Fig. 6 .
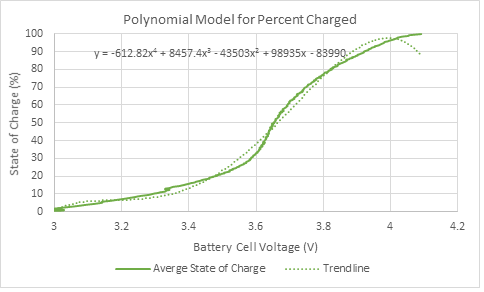
Fig. 6: Fourth-order polynomial that can be used to approximate the voltage of a battery to percentage of charge remaining.
Baseline test using the MAX17055
Finally, we compared these two approximations to the output of Maxim’s fuel gauge IC, the MAX17055. The MAX17055 outputs many results including cell voltage, load current, age, and temperature. It also uses the ModelGauge m5 algorithm to approximate SOC of the battery. The result of discharging the battery with a constant load produced a linear decrease in SOC over time, which is the result that we were hoping to see. You can see the readings from the fuel gauge IC by the purple graph in Fig. 7 , along with the linear and polynomial approximations described above.
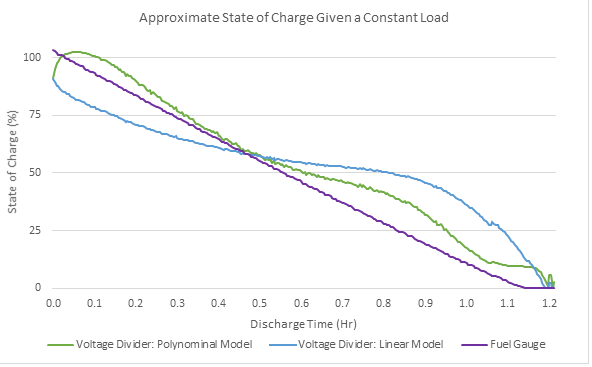
Fig. 7: Charge of a battery when discharged with a constant current based on the linear model from the voltage divider, the polynomial model from the voltage divider, and the SOC from the fuel gauge.
When looking at the results in Fig. 7 , it is obvious that each of the approximations assumes that the battery is 50% full and 25% full at different times. Fig. 8 shows the colors of the NeoPixels as the battery discharged. The bar graph on the right compares the percent runtime for each of the models that we used compared to the desired result that we expected to see. The bar graph of the linear model shows that the NeoPixels remained green, indicating >50% charge, when the battery was almost to a 25% charge!
![]()
Fig. 8: The graph on the left shows the NeoPixel colors during discharge using each model. The graph on the right illustrates the same data in a form that is easily comparable to the desired result.
In this case, the polynomial model and the fuel gauge both reported fairly accurate results. However, the actual design did not use a constant load current. Even if a model can work for constant current load, it may break when switching to a more realistic pulsed load.
Pulsing load test using all methods
To truly test the capabilities of all three fuel gauge methods, we had to run another experiment with a realistic pulsing load current placed in the system. The load alternated between drawing 125 mA for four minutes and drawing 60 mA for two minutes. We used the same three methods as for the baseline test above — the linear model based on the voltage divider, the polynomial model based on the voltage divider, and the SOC reported by the MAX17055. The results of the pulse load test can be seen in Fig. 9 . The purple line is the fuel gauge’s reported SOC over time. The blue line is the approximated SOC from the voltage divider using the linear model, while the green line is approximated using the polynomial model. Fig. 10 shows the color of the NeoPixels during discharge.
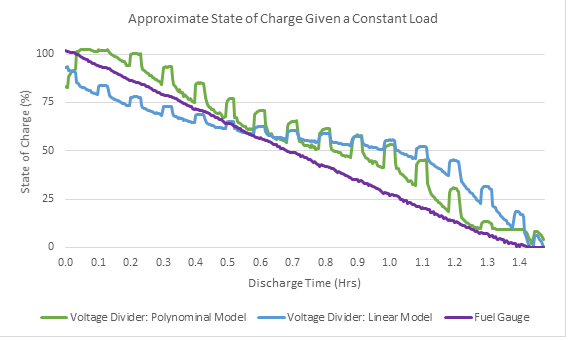
Fig. 9: Charge of a battery when discharged with a constant current based on the linear model from the voltage divider, the polynomial model from the voltage divider, and the SOC from the fuel gauge.
![]()
Fig. 10: The color of NeoPixels from each model when discharging a battery with pulsating load.
Both methods that used the results of the voltage divider to approximate the remaining battery capacity introduced errant pulses in their outputs. These results are clearly inaccurate and produce confusing results that alternate between green and yellow and yellow and red. This demonstrates the effect of a change in load on the terminal voltage of the battery. The sophisticated algorithm in Maxim’s fuel gauge shows the immunity to the loading effect and continues to output a linear decrease in the SOC matching the actual SOC of the battery. Considering that the load current in an application changes constantly, and not just once every few minutes, these findings only emphasize the importance of using a fuel gauge IC like the MAX17055.
Conclusion
When I am using my favorite portable electronic device, I want to feel confident in the accuracy of the remaining charge of the battery. While there are some simple, inexpensive methods of estimating the state of charge, their results are far from accurate. A method like the voltage divider described used on the FLORA reports data that varies greatly with load. This could leave me thinking that I have enough battery capacity left to walk an additional 10 minutes, only to have my dog’s tracker shut down before I have found her. More advanced fuel gauge ICs, like the MAX17055, provide accuracy that I can trust. The results from my experiments help to prove that a fuel gauge IC is worth every penny.
Advertisement
Learn more about Maxim Integrated


