Understanding battery drain lets designer use complexpower-management schemes to increase device runtime
BY EDWARD BROREIN and BOB ZOLLO
Agilent Technologies
Santa Clara, CA
http://www.agilent.com
Battery operating time is a critical factor in the design of mobile devices. Many mobile devices incorporate greater functionality, which can quickly reduce runtime. Engineers must employ complex power-management schemes to get the most runtime out of the battery.
To assess runtime, engineers use battery drain analysis, which entails characterizing the device, its firmware/software, and its subcircuits, both independently and in combination as a system. Analysis techniques include characterizing the battery current drain and how it is affected by the various operating modes and use profiles. With this analysis, engineers can make power management design tradeoffs that maximize battery life.
Most power management systems conserve battery power by putting to sleep, on a sub-millisecond time scale, subsystems that are not actively in use. The result is that the device draws a rapidly changing current with on/off events that can take place in a fraction of a second. For example, a GSM cell phone can have 560-µs, 2-A pulses when transmitting and then drop back down to milliamp levels during sleep periods, when in standby mode
Validating battery time
One approach to validating battery-operating time is to use a voltage rundown test where a fully charged battery powers the device under test (DUT) in the operating mode to be validated until the battery dies. This test can be relatively time-consuming as it runs to completion to identify the voltage shutdown point to determine operating time. Also, the results depend on the initial state of the battery, which can vary considerably.
An alternative approach is to perform a current-drain measurement that provides a higher confidence in operating time measurement. The DUT is placed in the operating mode to be evaluated for a short period of time, and the current drain is measured during that specific operating mode. The operating time is then calculated by dividing the nominal battery capacity by the measured current drain. With this method, a designer doesn’t have to wait for the battery to fully discharge to determine runtime.
Elements of an ideal system
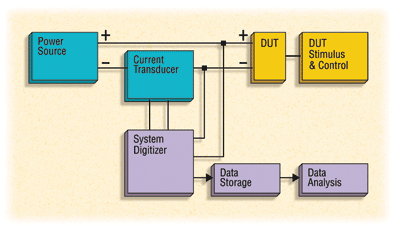
In an ideal system for performing battery drain analysis (see Fig. 1 ), A means for placing the DUT into the appropriate operating mode for the desired testing (DUT stimulus) is the first thing needed. For mobile phones, a base-station emulator is usually employed.

Fig. 1. There are several elements in a generic, ideal system for battery current-drain measurement and analysis.
Second, a means of properly powering the DUT is required, using either a battery or a power supply. A power supply is useful for testing the DUT independent of its battery to ensure consistency of test or to quickly replicate various battery states without having to wait for the battery to reach those states (fully charged, partially discharged, fully discharged/end-of-life).
Other important system elements are a current transducer for measuring current, a digitizer to log the voltage and current signals and software for analyzing and storing test data, which can be massive — up to gigabytes — for long-term tests.
Measurement considerations
Battery drain analysis using a power supply allows the DUT to be characterized independently of its battery. The power supply must have fast response to minimize transient voltage droop resulting from fast-slewing current pulses drawn by the DUT as it switches modes or transmits pulses.
Many general-purpose power supplies can exhibit up to 1 V of transient droop under these conditions, so a specialized power supply (sometimes called a battery-emulating power supply) that can tolerate these conditions without voltage droop should be used.
The rapidly changing current waveforms flowing from the battery into the mobile device present two measurement challenges: range and speed. First, the dynamic range of current can be greater than 1000:1 or even 1,000,000:1. With full power active currents on the order of 1 to 3 A, and with low-sleep-mode-level currents on the order of tens of microamperes, the range of current to be measured creates a challenge for selecting a current transducer.
A current-sense resistor, or current shunt, could be used but selecting the appropriate sized current shunt can be a challenge. If the shunt is sized to measure the lowest current, there will be a large voltage drop across the shunt during the high-current events, and this will place an unbearable burden voltage on the circuit. If the shunt is sized for the high current, there will most likely not be enough voltage to measure when microamperes are flowing. By going with several shunts for different sized measurements, an engineer can solve the signal level issue, but then switching shunts means interrupting the measurement.
With respect to measurement speed, the digitizer measures the current shunt voltage and the bias voltage to the mobile device should have a sample rate of 50 kHz or faster to capture sub-millisecond pulses characteristic of sophisticated power management schemes.
Simplifying complex analysis
Communications systems such as 3G employ complex modulation formats, characterized by high levels of amplitude modulation required to transmit higher data rates. The resulting current-drain waveforms are complex and random when viewed in the time domain.
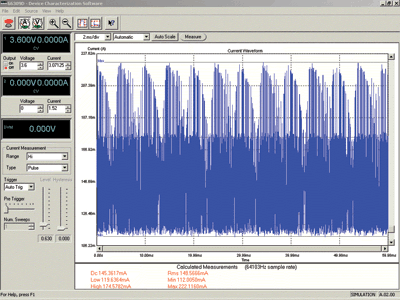
The current drain versus time for an RF power amplifier of a cdma2000 handset transmitting with three data channels (see Fig. 2a ) becomes more complex and unpredictable when run over long periods with varying operation. This scenario is typical for a battery operating-time test, and it is difficult to observe the effects of design changes on current drain.
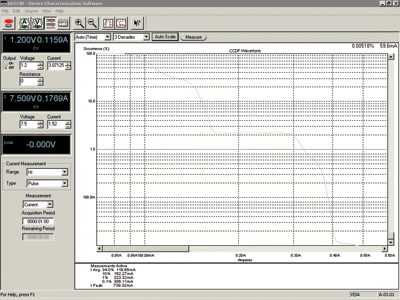
A better way to visualize and analyze complex current-drain patterns is to examine their statistical distribution, using a complimentary cumulative distribution function (CCDF) graph. A CCDF graph will plot current along the x-axis versus its cumulative percent of occurrence on the y-axis (see Fig. 2b ).


Fig. 2. The current-drain waveform of the RF power amplifier of a cdma2000 handset is complex and unpredictable when viewed in the time domain (left). The same current waveform viewed in a CCDF graph (b) lets designers easily see how often the device is in each current state.
By looking at the statistical distribution of how much current is being drawn, a designer can quickly see how often a device operates in each current state. Comparing these CCDF charts for various designs shows when the device consumes more power (that is, spends an increased percentage of its time in a high-current state) or when it consumes less power (i.e., spends an increased portion of its time in a low-current state). Therefore, an engineer can evaluate when a design is better (takes less power) or identify a design flaw (unexpectedly takes more power).
Off-the-shelf solutions
Several test equipment vendors make products that address various parts of the desired test system. Some vendors offer power supplies that can provide a stable, battery-like output when rapid current pulses are drawn.
An entry level solution is the Agilent Technologies 66300 Series of Mobile Communications DC Sources. The series is purpose-built for powering a mobile device and simultaneously measuring its current consumption. It integrates a battery-emulating power supply with a high-speed digitizing measurement system similar to an oscilloscope and can provide accurate current measurements for a device’s active, standby and off modes.
This dc source and its companion turnkey software lets users see their current waveforms in a scope-like view, a data-logger view, and on a CCDF chart, without any programming. If more accuracy and higher acquisition speeds are needed, other solutions are also available. ■
Advertisement
Learn more about Agilent Technologies


