Characterizing power supplies with an oscilloscope
A new technique being offered in the latest oscilloscopes opens up more productive means for analyzing power performance
BY MIKE HERTZ
LeCroy
Chestnut Ridge, NY
http://www.lecroy.com
Switch-mode power supply designers know that locating anomalous behavior within power device circuits is often challenging and time consuming. Manually monitoring a waveform is not practical for any long period of time. In addition, only reduced waveform record lengths can be monitored manually, and analysis is limited by human error.
Similarly, trigger circuits only highlight error conditions at the trigger point, and triggers cannot be used to define many types of error conditions, such as anomalous measurement results when cascading a chain of measurements and mathematical operators.
To solve these problems, designers can use a digital oscilloscope to automatically search for power device failures. The ability of a digital scope to automatically search a waveform for anomalies, to report the findings, and take appropriate actions based on user-defined criteria is known as waveform scanning. Waveform scanning is a new technique that has been deployed across a wide range of real-time digital oscilloscopes during the past year.
Wave scanning
Identifying frequency-stability problems within a switch-mode power supply can be greatly simplified by using waveform scans. When a scope detects the period of a waveform cycle, this value can be directly inverted to compute the instantaneous frequency of the specific waveform cycle.
Using all-instance measurements, instead of considering only the value of one cycle within the acquired waveform, the series of instantaneous frequencies of each cycle of an entire acquired input waveform can be computed as an array. With a tolerance band applied to instantaneous frequencies, the array of continuous instantaneous frequencies can be scanned by the oscilloscope to detect anomalous frequency content on a per-cycle basis. Waveform scanning technology automatically reports frequency anomalies graphically and numerically to identify all switching cycles which are outside of frequency stability margin requirements.
Measurement threshold
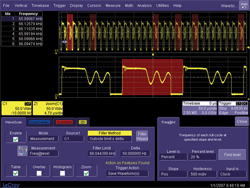
Consider the case in which the drain-to-source voltage of a power FET in a switch-mode supply (see Fig. 1 ) is probed differentially on Channel 1. In this instance, to allow for the frequency-at-level measurement parameter to include the switching frequency only and to exclude all higher-frequency oscillations, the threshold level of the frequency measurement parameter is set at 20% of the waveform amplitude level. The user can visually inspect the waveform levels to determine the appropriate threshold level setting.
For waveforms with oscillations within the period range, the threshold level should be increased or decreased to include rising edges of the primary switching cycle only. The scanning filter limit in this case was set to the nominal instantaneous cycle frequency of 66.04 kHz, with a 50-Hz delta defining the frequency tolerance band.
The triggering action chosen for this resultant scan of frequency is set so as to save waveform data when the frequency stability margin is exceeded. The oscilloscope has displayed a red box encompassing each entire waveform cycle which violates the defined scan tolerance band, indicating that six cycles from the supply have failed to meet the selected criteria.

Fig. 1. Waveform scanning automatically identifies and highlights six switching cycles with instantaneous frequencies outside of the defined frequency stability region. A zoom of one of the anomalous cycles is automatically highlighted in red in the lower grid.
The track wave
When monitoring for a short period of time, say microseconds, scanning adjacent pulses cycles from the controller IC will show short-term fluctuations and anomalies in the pulse stream. When monitoring for a larger period of time like milliseconds, scanning the entire waveform array can reveal macro-effects occurring in the evolving set of duty cycle measurements.
Applying a mathematical tracking function to a set of measurement parameter values results in the construction of a new waveform showing parameter value as a function of position. This new Track waveform, unlike an acquired waveform, has a measurement parameter value for its y axis and the x axis of the track waveform is identical to the acquired pulse stream and shares the same x-axis time scaling.
A track of duty cycle will plot duty cycle as a function of time. As duty cycle changes slowly over time, the shape and timing characteristics of the Track reveal important information not visually available from the input waveform itself. The overall shape can be used to characterize power supply stability under load changes, line changes, soft-starts, dropouts, hot swap, and short circuits. In addition, the behavior of the control loop can be examined on a cycle-by-cycle basis.
Derivative dividends
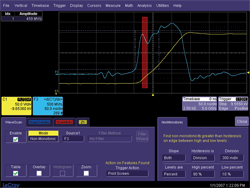
Another important switching characteristic of a power supply’s MOSFET is the linearity of its voltage turn-off transient. The rate of change of the switching transistor’s output can be computed directly using the built-in capability of the scope’s derivative math function. Tiny fluctuations within the slope of the voltage transition are easily detected by use of the derivative math processor. Automatic detection of monotonicity of the dV/dt trace, however, requires the oscilloscope to examine the edge of the derivative waveform using waveform scanning techniques.
Selecting a non-monotonic mode and applying it the derivative waveform of the input trace (see Fig. 2 ) produces the desired result. The scope has detected a slight ringback in the dV/dt waveform and has highlighted this in red in the graticule. The dashed blue guidelines show the area where monotonicity is being monitored on each sweep.
Waveform scanning has been configured to capture a screen image of each non-monotonic edge detected during the scan. In this example, another level of abstraction has been applied to the search criteria, as measurements applied to a math function are used as the criteria for waveform scanning.

Fig. 2. Waveform scanning has identified a non-monotonicity in the Vgs turn-off transient. The gate-to-source voltage transition (yellow trace), first derivative dV/dt (blue trace), and non-monotonic edge (highlighted in red) are displayed.
The examples of waveform scanning discussed herefrequency stability of switching cycles, control loop response, and non-monotonic edge detectionare only a few of the technique’s possibilities. It can also be generalized to troubleshoot other types of undesirable behavior in power circuits.
Get more information on oscilloscopes at www.electronicproducts.com/testmeasure.asp ■
Advertisement
Learn more about Teledyne Lecroy


