Choosing an appropriate RF spectrum analyzer
With the RF spectrum being used in new, more complex ways, users must better understand key performance-testing tools
BY DARREN MCCARTHY
Tektronix, Beaverton, OR
http://www.tektronix.com
Technological innovation in RF continues to advance relentlessly, due in large part to sustained growth in the military and communications sectors. Commercial communications networks and modern radar systems have become extremely complex in order to resist interference, avoid detection, and improve capacity.
Further, sophisticated combinations of RF techniques such as complex and adaptive modulation, bursting, and frequency hopping are typically being used in these advanced applications. At the same time, the increasingly widespread success of cellular technology and wireless data networks, combined with the advancing state of semiconductor technology and packaging, has caused the cost of basic RF components to drop significantly.
As RF signals have become ubiquitous, so too have problems with interference. To overcome these evolving challenges, it is crucial that signal analysts, engineers, and scientists be able to reliably detect and characterize RF signals.
RF test options
The essential tool for looking at the broad range of signals involved in the RF operation of electronic systems is the spectrum analyzer. Over the years, the nature of this tool has changed, providing more and more precise measurement capability. Today, swept spectrum, vector signal, and real-time spectrum analyzers provide vastly different capabilities that users must understand in order to select the correct tool for the job at hand.
The basic architecture of the swept spectrum analyzer was created over half a century ago, when the RF challenges revolved around measuring the stability and spectrum occupancy of stationary RF broadcast technologies. Analog modulations from high powered transmitters needed to be verified, to be sure that the transmitters did not have long-term drift issues. Low-level tonal interference issues required the high-dynamic-range, frequency-selective architecture of the swept spectrum analyzer to validate emissions compliance for out-of-channel performance.
Swept- frequency analysis inherently can only detect the total power contained within the bandwidth of the detector as it is effectively swept across a wide frequency band of interest. RF activity which occurs in a portion of the band being swept will not be seen if the time of occurrence for the signal of interest is different than when the detector is tuned to that frequency. Therefore, as the detector sweeps, such an analyzer will provide a low probability of intercept for transient signals of duration less than the entire recurrent sweep time. This makes the frequency-swept analyzer best suited for signals which remain stable for one or more complete sweep cycles.
While most swept analyzers have the capability to stop the sweeping of the RF conversion oscillator and simply look at one frequency continuously versus time (zero-span mode), this requires knowing the exact frequency in advance. Zero-span can only display amplitude versus time within the maximum Resolution Bandwidth (RBW) setting of the instrument and cannot separate multiple signals across a wide span as in a spectrum plot.
Vector signal analyzer (VSA)
With the advent of digital communications signals in the early 1990’s, the need for a new type of analyzer emerged. To resolve the problems of time-varying communications and to test digitally modulated signals over specified periods of time, the vector signal analyzer architecture was developed.
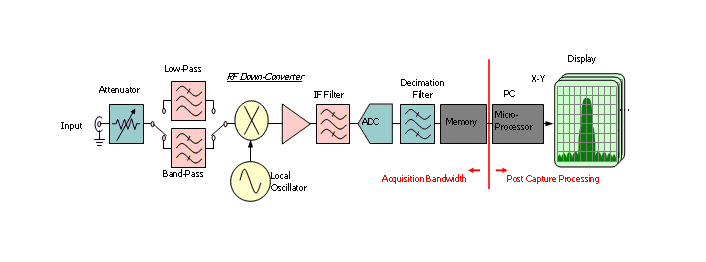
A vector signal analyzer (see Fig. 1 ) has a similar RF conversion front end to the swept analyzer, but the IF section has a wideband filter and analog-to-digital converter. The A/D converter digitizes the entire wideband IF of interest and stores the data in memory. Then a discrete Fourier transform (DFT) process is applied to the data in memory to analyze the time-variations of the RF signals.

Fig. 1. Block diagram of a vector signal analyzer.
In a VSA, the DFT analysis is performed after the data is stored in memory. The frequency spectrum plots available from the DFT are presented to the operator only as fast as the display can update, and then another DFT is initiated. This process eliminates the dead time found in the swept analyzer during the sweep for a finite period of time, but the data acquisitions are not continuous. Screen updates have the processing and display time gaps between spectrum updates where significant input signal activity can be missed.
VSA’s are a good tool to use when defined models of signal behavior can be synchronized to the measurement acquisition. For example, a device under test in a manufacturing environment might be setup to transmit specific, standards-based test models.
Real-time spectrum analyzer
However, when RF devices are in the field or tested during non-standard modes (like during adaptive changes or in conjunction with other co-existing wireless standards), it is important that data acquisitions be continuous, so all signal conditions might be observed.
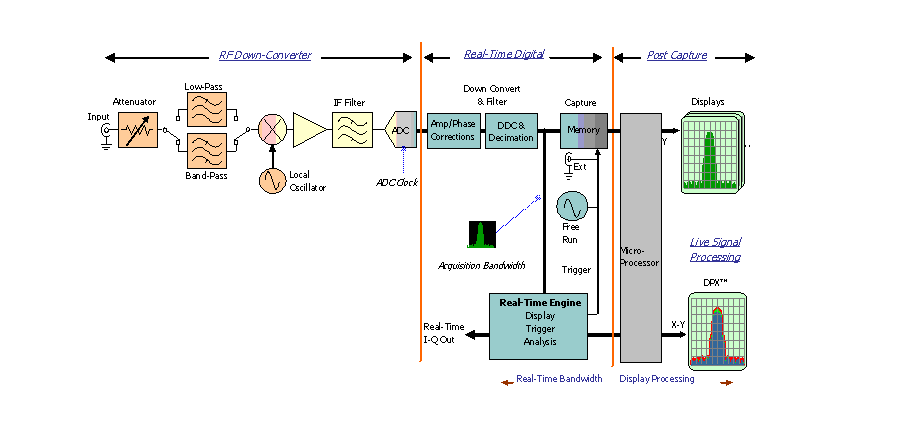
To accomplish this, the real-time spectrum analyzer (see Fig. 2 ) provides a fundamental architecture shift. The wideband IF is still digitized, but now the discrete time transform, such as FFT or Chirp-Z transform (CZT), is performed in a signal processing block that processes the digital data in full real-time with no gaps. This is prior to, or concurrent with, that data entering the digital memory.
The real-time processing engine seen between the two vertical red lines in Fig. 2, is a combination of hardware and software that is optimized to perform correction, filtering, and DFT processing fast enough to keep up with the digitizer output. This real-time-processing block reveals all time-domain changes in the RF signals (frequency-domain) present within the IF bandwidth.

Fig. 2. Block diagram of a real-time spectrum analyzer.
One reason for the development of the RTSA was the need to increase the probability of fully intercepting wide bandwidth signals exhibiting variations in both frequency and time with no gaps in the observation of the signal. In this case, the definition of 100% full intercept of minimum event duration of an RF bursted signal has three conditions to be met:
The minimum event duration is defined as the narrowest rectangular pulse that can be accurately captured within the specified instrument accuracy.The ADC clock rate and capture interval must support the span and resolution bandwidth of the rectangular pulse.The DFT transforms are computed at a rate that support the minimum event duration.
If these conditions are met:
The resulting spectrum plot will show the full signal amplitude.Signal amplitude will not vary if relative timing of the DFT frames and the signal burst changes.The spectrum of 100% of the bursts will have full amplitude; no spectrum is lost.
The A/D converter continuously outputs digital samples of the analog input. Once one frame of contiguous samples has been passed to the DFT, the transform process can start. In order not to miss any of the input signals, the DFT frames must be overlapped enough that the window functions do not cause the loss of any of input data.
The result of spectrum processing without gaps is a spectrum display that reveals all spectral variations within the capture bandwidth. (See sidebar, “Seeing the spectrum without gaps reveals behavior over time,” http://www2.electronicproducts.com/-article-farc_tek_s_jul2009-html.aspx.) ■
Advertisement
Learn more about Tektronix


