Debugging software on Cortex-M3 and -M4 devices
What’s going on inside that microcontroller?
BY TOMAS HEDQVIST
IAR Systems
Uppsala, Sweden
http://www.iar.com
Hopefully you know perfectly well what the software in your microcontroller is supposed to do. However, if you have been asking yourself why it doesn’t work as expected and wondered what it is actually doing in there, then trust me, you’re not alone.
Maybe you have written an asynchronous application that makes use of a multitasking operating system and event-driven interrupts. Debug methods such as printf instrumentation or setting breakpoints and single-stepping the application are tiresome and ineffective, and are also likely to miss the most intricate timing issues as the core is constantly being halted.
If the device you are using for your project is built on the ARM Cortex-M3 or -M4 core, you can relax, since it incorporates some powerful debug logic. A capable debugger can make good use of this logic, providing the capability to examine the application’s behavior from various angles.
ARM Cortex-M3 and Cortex-M4 debug architecture
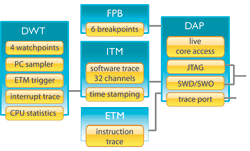
The debug architecture consists of five main units (see Fig. 1 ). Some of these, like the embedded trace macrocell (ETM), are optional and implemented only in some devices. We will focus on the instrumentation trace macrocell (ITM), data watchpoint and trace (DWT) and ETM, and how a debugger can use them. First we will briefly examine an important concept for all ARM Cortex-M debugging: serial wire debug (SWD).

Fig. 1. The debug architecture of the ARM Cortex-M3 and M4 devices.
While the JTAG interface was originally designed for testing, the SWD was designed from scratch as a low-cost debug interface, replacing the former while providing better control and more useful features to the user. SWD uses only two pins that are overlaid on the JTAG pins, so no extra pins are needed. An SWD debug probe is required to use this debug mode, but most JTAG probes for ARM cores handle the SWD port.
Serial-wire output (SWO) is a high-speed channel that transmits packets from the ITM to the debugger without stopping execution. It uses either serial UART or Manchester encoding. As we shall see, it provides some very useful functionality together with the ITM and DWT. SWO requires SWD as debug mode. It cannot be used in JTAG mode.
Instrumentation trace macrocell
The instrumentation trace macrocell (ITM) is a central part of the debug logic in the ARM Cortex-M3/M4 cores. It is a lightweight trace that provides selected trace data over a low-speed access port. The good thing is that you do not need a separate trace probe, as most SWD probes can handle the ITM trace functionality.
So, what do we mean by a lightweight trace? The ITM provides 32 channels for software trace that can be used by the software to generate packets to the ITM for distribution to the debugger over SWO. This can be used for instrumentation of the code with very little overhead as the core does not need to stop to output the message or data. All that is needed is a single write operation to one of the 32 ITM stimulus registers.
The ITM also takes care of trace events triggered by another unit, the DWT. The role of the ITM in this case is to format these events and packetize them. Optionally, it can also timestamp each package it sends away.
Data watchpoint and trace
The DWT provides a set of functions that collect information from the system buses and generates events to the ITM for packetizing and time stamping and further distribution on the SWO channel.
Watchpoints. There are four independent comparators or watchpoints in the DWT that can generate an event on an address match or a data match. They can be used for various purposes, including triggering the ETM, triggering an ITM package, or break the code at certain conditions.
One of the four watchpoints can also be used to trigger the ETM. This is useful when debugging applications that run for a longer time, as it makes it possible to set not just plain trace start and stop breakpoints that starts and stops the trace data collection at specified addresses, but also complex trace start and stop conditions that for example could be based on when a variable reaches a certain value.
Interrupt trace. The DWT also provides an interrupt trace function. When there is interrupt activity an event is triggered and an ITM packet is generated. The packet is time stamped by the ITM and forwarded through the SWO to the debugger that can log the events and display them in real time.
The PC sampler
The DWT contains a PC sampler that samples the program counter register, PC, at regular intervals. As the sampling is likely to miss most instructions that are executed, it will not be able to give a complete view of the applications whereabouts, but it will be able to provide sufficient information about where the application has spent its time.
Embedded trace macrocell
The debug functionality accessed through the SWD is very useful and may be sufficient for most embedded projects, but sometimes you will need an even more powerful debug mode to get down to the most difficult problems. Then you need full instruction trace. The ETM unit provides full real-time instruction trace over a 4-bit high-speed trace bus. Of necessity, ETM trace data are compressed.
ETM is only implemented in the higher-performance devices using these cores. Unlike the event trace provided by the DWT and ITM, the ETM will let you know what your application was doing before it received an interrupt, what it is doing while the ISR is executing, and what happens after it leaves.
It will tell you where the application has been and exactly how it got there. In short, it will give you full insight to your applications behavior in real-time without being intrusive. The only real downside is that you will need a special trace debug probe to take advantage of the capabilities. On the other hand, it is not nearly as expensive as a full in-circuit emulator.
Some devices are fitted with an embedded trace buffer (ETB) that is built into the microcontroller, providing the same functionality as an external trace probe but with a smaller buffer. When using the ETB, you need to take special care when setting the trace triggers, as you will not be able to record very many instructions. But, it can be used with a low-cost standard JTAG probe and still provide sequences of full instruction trace.

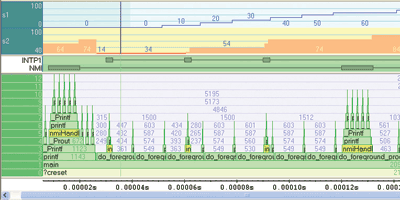
Fig. 2. The interrupt graph, call stack visualization, and plotting of variables in the timeline window in IAR Embedded Workbench.
The captured trace data can be used to display the applications behavior in a multitude of views. For example, IAR Embedded Workbench gives you a very useful overview of the call stack by plotting nested function calls over time (see Fig. 2 ).
Trace data can also be used when you are analyzing the application. For example, function profiling that with SWD/SWO is done using statistic sampling of the PC is based on the full execution history when you are using ETM, providing higher accuracy and avoiding systematic errors due to periodicity. ■
Advertisement
Learn more about IAR Systems


