Designing-in LED driver reliability: Smart non-isolated PFC
Reliability calculations can be used to help a designer understand the trade-off in topology or component selection.
BY BRIAN JOHNSON and RAYMOND OAKLEY
Fairchild Semiconductor
www.fairchildsemi.com
Electronic manufacturers battling product reliability issues with their designs revealed the need to measure and quantify how well a product performs during its service life. Out of these challenges came the mathematical concept, mean time between failure (MTBF), a repairable system methodology exhibiting an exponential cumulative distribution function.
The MTBF value is a quantity that expresses the magnitude of reliability found in a product, is quoted as the key characteristic upon which engineers compare designs, and has become a number advertised with electronic products that quantifies the product’s reliability. The concept supplies the definitive ability to express ideas in a readily understood manner giving engineers the ability to compare design choices before committing resources in people, time, and development costs to compliance testing.
MTBF is not the average or the minimum time before a product’s first failure, it can be best defined by a simple fraction:

An MTBF value is the result of dividing the power-on hours for a population of products by the total number of failures in that population. Therefore, the units for an MTBF value are hours/fail. The unit for a failure rate is fails/hour. For an MTBF:

MTBF can be expressed as a failure rate, 1 failure in a billion device-hours = FIT (Failures in Time).
MTBFs are not additive — failure rates are additive. The failure rate of the assembly is the sum of the failure rates of the components. Empirically based reliability models use failures rates.
There are several methods to calculate the failure rate for an assembly. Using the reliability prediction procedure Telecordia SR-332, several LED driver topologies commonly found for low power bulb type applications can be compared.[1] The topologies considered in this article are:
Non-isolated buck topology without electrolytic capacitorsNon-isolated buck topology with an electrolytic output capacitorIsolated flyback topology using primary-side controlIsolated flyback topology using secondary-side control (optocoupler based feedback)Two-stage with a PFC stage followed with a dc/dc stage using primary-side control
How useful is it to know a failure rate or MTBF? First, as a quantity of comparison, it allows a designer to judge between designs to perform the same task. Second, failure rates can be calculated using small samples of products and so the reliability of the product population can be extrapolated. Third, failure rates are the key variable in warranty repair costs, which is a factor used to assess the future profitability of a product. The failure rate for an assembly can be used to decide how large a repair center is needed, how large it’s staff should be, and what the repair center’s budgetary requirements will be.
The method in this LED driver comparison consists of using similar bill-of-materials (BOM), assuming there is a low power A19 design, 10-W load — with a key assumption that similar components are used across all of the compared LED topologies. In other words, the compared topologies use the same MOSFETs, transformers or inductors, EMC filters, etc. in order to normalize the BOMs to generate comparison failure rates. This normalization removes a designer’s ability to use component selection to tweak a design’s failure rate.
With similar components, similar FIT rates may be applied with device failure rates from the Telecordia SR-332 specification in order to sum a design topology FIT rate. The example FIT rates applied across different components to create a normalized calculation is shown in Table 1 . Notice the optocoupler has the highest failure rate, also note that acceleration factors have not been applied to Table 1 FIT rates.

Table 1. Assumed Component Device Failure Rates (FIT)
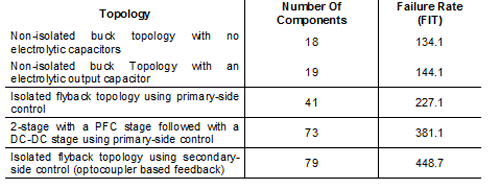
Applying these common values to the LED driver BOMs, Table 2 shows the component counts and final FIT values.

Table 2. LED Driver Comparisons
There are several important points to be recognized from the data in Table 2. As the number of components increases, the failure rate also increases — the axiom “component count reduction increases reliability” holds true. The addition of an electrolytic capacitor will reduce the assembly reliability, but the acceleration of component failures because of temperature, voltage and current, or other stresses will affect the overall LED driver reliability. Wear-out from solder joints is also not accounted, however, based on the first pass assumption there are two solder joints per component, so the FIT rates for the topologies in Table 2 would increase but not change in order of topology preference because the component count is shown to be increasing.
The data in Table 2 does not take into account significant quality, stress, and temperature factors. Quality is related to the component’s packaging ability to eliminate environmental causes of reduced reliability. For example, does the electrolytic capacitor case resist moisture or expand/contract with temperature variations? Electrical stress would include the electrolytic capacitor ripple current and voltage ripple. Temperature, for an LED driver, is one of the greatest accelerators to reduce reliability because the typical residential bulb-type applications are potentially in worse-case environments. The fixture, once populated with an incandescent bulb with heat radiating as IR energy, is replaced with a LED bulb that relies more on conduction through the fixture to keep the temperature low in the LED driver. This is especially true when air flow is not present in a downward oriented fixture. The temperature stress factor is dominant in most LED driver designs and is offset by the use of higher rated temperature electrolytic capacitors or the elimination of electrolytic capacitors all together – the trade-off being capacitor cost.
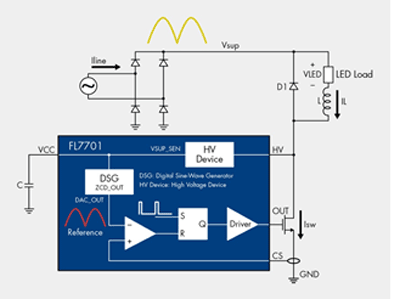
The lowest FIT rate in Table 2 is for the non-isolated buck topology with no electrolytic capacitors; the Fairchild FL7701 is an example design controller shown in Fig. 1 .[2]

Fig. 1: Fairchild FL7701 non-isolated buck LED driver.
The FL7701 driver controller IC has PFC integrated into its control strategy and the control IC can be powered from the rectified off-line input using a small ceramic capacitor for hold-up. This alone eliminates the need for an input electrolytic capacitor and the electrolytic capacitor used for the IC self-bias rail. With a LED load that does not have to meet tight current ripple requirements, all electrolytic capacitors can be eliminated, improving the warranty period of the driver. The ripple current on the LEDs may decrease their lifetime but the trade-off in reliability between the LED driver and the LEDs may result in a better overall reliability figure for the fixture on the wholeThis topology has the lowest BOM count and can be used without electrolytic capacitors to have a significantly lower FIT rate, almost a half to a third lower failure rate than other leading topology choices for LED driver designs, as seen in Table 2. Using a driver such as the FL7701 will reduce the MTBF value of a typical LED driver circuit while adding an electrolytic capacitor will still keep the failure rate less than other major topologies.
The calculations used in this article are not meant to be final predictors for LED driver reliability. Acceleration factors have not been applied so the actual LED driver reliability requires testing of the drivers in an application environment known as life testing. Nevertheless, reliability calculations can be used to help a designer understand the trade-off in topology selection or component selection. A non-isolated buck topology offers a low component count which in turn may result in good reliability ratings, if the ambient temperature around the LED driver components can be managed properly.
References
[1] Reliability Prediction Procedure for Electronic Equipment, Telcordia Technologies SR-332 , Issue 1, May 2001
■
Advertisement
Learn more about Fairchild Semiconductor


