Fundamentals: Understanding reliability terminology and factors that affect power supply reliability
Learn the terms, explanations and formulas needed to help you design reliable products
BY GARY BOCOCK
Technical Director
XP Power
www.xppower.com
There are many aspects to understanding how to design reliable products, but let’s start by some explanation of the terminology used when describing reliability.
Failure rate, λ (lambda), is defined as the percentage of units failing per unit of time. This varies throughout the life of the equipment and if λ is plotted against time, a characteristic bathtub curve (see Fig. 1 ) is obtained for most electronic equipment.
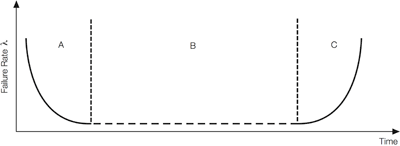
Fig. 1: The bathtub curve has regions A – Infant mortality, B – Useful life, C – Wear out
In region A, poor workmanship and substandard components cause failures. This period is usually over within the first few tens of hours and burn-in is normally employed to prevent these failures occurring in the field. Burn-in does not entirely stop the failures occurring but is designed to ensure that they happen within the manufacturing location rather than at the customer’s premises or in the field. Next is region B. Here the failure rate is approximately constant and it is only for this region that the following analysis applies.
Finally, in region C, components begin to fail through reaching end of life rather than by random failures. Electrolytic capacitors dry out, fan bearings seize up, switch mechanisms wear out and so on. Well implemented preventative maintenance can delay the onset of this region.
Reliability is defined as the probability that a piece of equipment operating under specified conditions will perform satisfactorily for a given period of time. Probability is involved since it is impossible to predict the behavior with absolute certainty. The criterion for satisfactory performance must be defined as well as the operating conditions such as input, output, temperature, load etc.
Mean time between failures (MTBF) applies to equipment that is going to be repaired and returned to service, Mean time to failure (MTTF) to parts that will be thrown away on failing. MTBF is the inverse of the failure rate and is often misunderstood. It is often assumed that the MTBF figure indicates a minimum guaranteed time between failures. This assumption is incorrect, and for this reason the use of failure rate rather than MTBF is recommended. The mathematics are expressed in Fig. 2 :
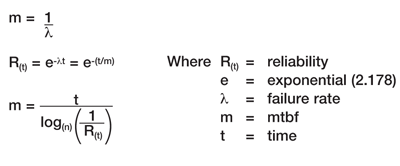
Fig. 2: The reliability formula
This shows that for a constant failure rate, plotting reliability ‘R(t)’ against time ‘t’ gives a negative exponential curve (see Fig. 3 ). When t/m = 1, that is, after a time ‘t’, numerically equal to the MTBF figure ‘m’, then
R(t) = e-1 = 0.37
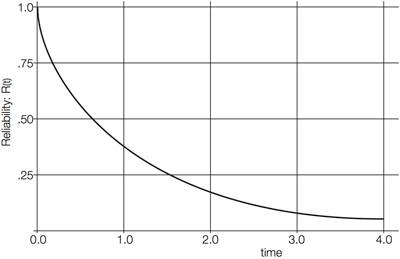
Fig. 3: The reliability curve
This equation can be interpreted in a number of ways:
a) If a large number of units are considered, only 37% of them will survive for as long as the MTBF figure.
b) For a single unit, the probability that it will work for as long as its MTBF figure is only 37%.
c) The unit will work for as long as its MTBF figure with a 37% Confidence Level.
To put these numbers into context, consider a power supply with an MTBF of 500,000 h (or a failure rate of 0.002 failures per 1,000 h), or as the advertisers would put it, an MTBF figure of 57 years. Using the above equation, R(t) for 26,280 hours (three years) is approximately 0.95 and if such a unit is used 24 hours a day for three years the probability of it surviving is 95%. The same calculation for a 10-year period will give an R(t) of 84%. If 700 units are used, then on average 0.2%/1000-h will fail, or approximately one per month.
There is no direct connection or correlation between service life and failure rate (see Fig. 4 ). It is perfectly possible to design a very reliable product with a short life. A typical example is a missile, which has to be very very reliable (MTBF of several million hours), but its service life is only around 4 minutes (0.06 h). 25-year-old humans have an MTBF of about 800 years, (failure rate of 0.1% per year), but not many have a comparable service life. If something has a long MTBF, it does not necessarily have a long service life.
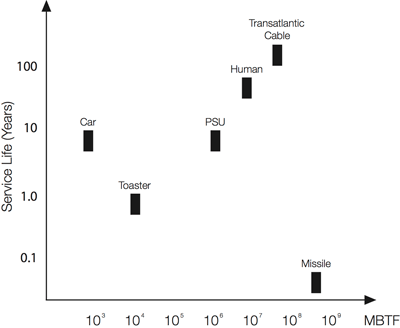
Fig. 4: Comparing service life of different items
Factors affecting reliability
The most important factor is good, careful design based on sound experience, resulting in known safety margins. Unfortunately, this does not show up in any predictions, since they assume a perfect design.
Many field failures of electronic equipment are not due to the classical random failure pattern discussed here, but to shortcomings in the design and in the application of the components, as well as external factors such as occasional voltage surges. These may be outside of the specification but no one will ever know, as all that will be seen is a failed unit. Making the units rugged through careful design and controlled overstress testing is a very important part of making the product reliable.
The failure rate of the equipment depends on the following three factors:
Complexity Keep things simple, because what isn’t there can’t fail but, conversely, what isn’t there can cause a failure. A complicated or difficult specification will invariably result in reduced reliability. This is not due to the shortcomings of the design staff, but to the resultant component count. Every component used will contribute to the equipment’s unreliability.
Stress For electronic equipment, the most prominent stresses are temperature, voltage, vibration and temperature rise due to current. The effect of each of these stresses on each of the components must be considered. In order to achieve good reliability, various derating factors have to be applied to these stress levels. The derating has to be traded off against cost and size implications. Great care and attention to detail is necessary to reduce thermal stresses as far as possible. The layout has to be such that heat-generating components are kept away from other components and are adequately cooled. Thermal barriers are used where necessary and adequate ventilation needs to be provided. The importance of these provisions cannot be overstressed since the failure rate of the components will double for a 10 ºC increase in temperature. Decreasing the size of a unit without increasing its efficiency will make it hotter, and therefore less reliable.
Generic Generic reliability (also known as inherent reliability) refers to the fact that, for example, film capacitors are more reliable than electrolytic capacitors, wirewrap connections more reliable than soldered ones, fixed resistors more reliable than potentiometers. Components have to be carefully selected to avoid the types with high generic failure rates. Quite often there is a cost trade-off, as more reliable components can be more expensive.
Estimating the failure rate
The failure rate should be estimated and measured throughout the life of the equipment. During the design, it is predicted. During the manufacture, it is assessed. During the service life, it is observed.
The failure rate is predicted by evaluating each of the factors affecting reliability for each component and then summing these to obtain the failure rate of the whole equipment. It is essential that the database used is defined and used consistently. There are three databases in common use: MIL-HDBK-217, HRD5 and Bellcore. These reflect the experiences of the US Navy, British Telecom and Bell Telephone respectively.
In general, predictions assume that the design is perfect, the stresses known, everything is within ratings at all times, so that only random failures occur; every failure of every part will cause the equipment to fail and that the database is valid. These assumptions are incorrect. The design is less than perfect, not every failure of every part will cause the equipment to fail, and the database is likely to be 15 years out of date. However, none of this matters as long as the predictions are used to compare different topologies or approaches rather than to establish an absolute figure for reliability. This is what predictions should be used for.
Prediction
Here are three methods used for predicting reliability:
Parts stress method In this method, each factor affecting reliability for each component is evaluated. Since the average power supply has over 100 components and each component about seven factors (stress ratio, generic, temperature, quality, environment, construction and complexity), this method requires considerable effort and time. Predictions are usually made in order to compare different approaches of topologies, i.e. when detailed design information is not available and the design itself is still in a fluid state. Under such circumstances it is hardly worthwhile to expend this effort and the much simpler and quicker Parts count method is used.
Parts count method In this method, all like components are grouped together, and average factors allocated for the group. So, for example, instead of working out all the factors for each of the 15 electrolytic capacitors used there is only one entry of capacitor with a quantity of 15. Usually only two factors are allocated, generic and quality. The other factors, including stress levels, are assumed to be at some realistic level and allowed for in the calculation. For this reason, the factors are not interchangeable between the two methods. In general, for power supplies, HRD5 gives the most favourable result closely followed by Bellcore, with MIL-217 the least favorable. This depends on the mix of components in the particular equipment, since one database is ‘unfair’ on ICs, and another on FETs. Hence the importance of comparing results from like databases only.
Assessment This is the most useful and accurate way of predicting the failure rate. A number of units are put on life test, at an elevated temperature, and so the stresses and the environment are controlled.
With all the sophisticated computer analysis available, there is still no substitute for thoroughly testing products or components. One way of doing this would be to perform HALT testing. HALT (Highly Accelerated Life Test) is used to test as many different conditions as possible and cycling the temperature, input and load independently.
A final point is attention to the manufacturing method used. Manual assembly can be prone to errors and unintentional stressing of components. Careful control and management of supply chain practices should be observed.
■
Advertisement
Learn more about XP Power


