There are a lot of things to consider when determining the economic competitiveness of an electricity generating technology; ultimately, though, it boils down to two fundamental factors—how much does it cost to build, and how much does it cost to operate? This is especially important when weighing established technologies like natural gas against up-and-coming alternatives like solar and wind power.

Just recently, the U.S. Energy Information Administration (EIA) began collecting data related to the construction costs of all new electric generators at utility-scale power plants. The publication released earlier this month covers generators installed in 2013; the EIA expects to publish 2014 construction cost information in August 2016, and 2015 information October 2016.
While other publications have reported estimates of electricity generating technology capital costs in the past, this marks the first time one has included actual construction costs — including capital and financing costs.
Government grants, tax benefits, and other incentive-related benefits are excluded from these costs. Also, due to the fact that these are costs tied to utility-scale power plants — that is, individual company data — the analysis has been averaged out for select groupings. The result is a collection of market prices for generation technologies at the time the projects were developed and built.
Broad stroke observations — fuel costs typically make up a substantial portion of fuel-consuming generation technologies, while initial construction costs count for most of nonfuel-consuming technologies. Also, the EIA found that different types of plants generally run at different utilization rates, which influences the general economics of the electricity generation technologies. Capacity additions of these technologies have, in turn, adjusted over the years as costs, market conditions, and government policies have changed or otherwise been adjusted.
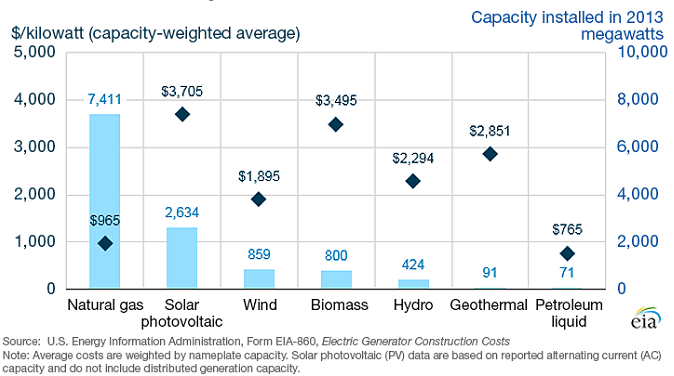
Now, getting into the numbers . . .
Natural Gas was responsible for most of the electricity generation capacity in 2013. Construction costs of this technology averaged out at $965 per kilowatt (kW) of installed capacity. Most of the installations were combustion turbine and combined-cycle plants. The former generally serves during peak times only; as such, they’re less expensive to build than combined-cycle plants, but more expensive to run because of their low energy conversion efficiency. Combined-cycle plants, which include at least one steam turbine and one combustion turbine, are more efficient and less expensive to run. As such, they were more generally utilized, and typically served as the main power plant for a given area. These plants can also be built relatively quickly (in less than twelve months), and can have an immediate impact on near-term localized supply or reliability needs.
Solar Energy had an average construction cost of $3,705 per kilowatt (kW) of installed capacity. Those using a tracking system were more expensive per kilowatt than stationary models; however, they were more often used for larger projects as they’ve proven to increase the system’s output. And while thin-film panels versus crystalline silicon panels cost approximately the same to build, the former had a significantly greater average capacity (74mW) than the latter (7mW). Finally, worth noting is that this data is based on reported alternating current capacity, which likely differs from other cost and capacity estimates for direct current rating on solar panels.
Wind Energy averaged out at $1,895 per kilowatt (kW) of installed capacity; this was the lowest of all renewable technologies. While impressive, it did little to convince plant owners to incorporate the technology—new wind capacity in 2013 was less than 900 MW, a significant drop from 2012 when there was an addition of 13,084 MW. The reason why — the federal production tax credit tied to the technology expired at the end of 2012. It was renewed in early 2013, but given lead times necessary for wind projects, along with a change in the tax credit’s eligibility requirements, only a handful of wind plants actually went up that year.
The EIA has put together the table below to summarize the average construction costs for generators installed in 2013:
Via the EIA
Advertisement
Learn more about Electronic Products Magazine


