GDT selection principles for telecom equipment
Using GDTs to protect from surges caused by lightning strikes and storms
BY TIM ARDLEY
Bourns, Riverside CA
http://www.bourns.com
Gas discharge tubes (GDTs) are often used to protect sensitive telecom equipment from lightning strikes and storms that have the potential to cause transient surges that can result in severe damage. GDT impulse sparkover voltage ratings are characterized with ramp voltages such as 100 V/µs or 1,000 V/µs. Lightning strikes have been characterized as being a minimum of 30 kA with a very short duration. The energy produced by a primary protector is similar to a traditional telecom surge with a rise time (TR ) and decay time (TF ) such as 500 A, 10/250 µs.
Engineers should be aware of several principles when selecting a GDT that can withstand severe electrical conditions. The first question to ask is what is the impulse sparkover voltage of the GDT? This is to ensure current coordination with the common secondary thyristor for secure protection.
The 1,000 V/µs is commonly used to specify the impulse sparkover voltage needed. However, this rating is often 150% above the actual surge impulse voltage, and is generally considered the worst case scenario. Designing to this rating would give the system a robustness that is not required and, for most applications, would be over-engineered for the task.
This article will examine how to best predict the ramp or surge impulse voltage to find the expected peak voltage with a known DCBD voltage option. With this information, a formula can be developed for a more accurate method of understanding the GDT let-through voltage.
The surge impulse voltage during extreme telecom surges will be investigated as well as the let-through pulse of a GDT to help designers predict what energy levels the secondary protection could experience. The on-state voltage or arc voltage will also be examined.
Predicting peak voltage
Designers should first examine the ramp impulse sparkover rating of a specific GDT. For example, if a manufacturer documents the ramp impulse sparkover rating to be DCBD 100 V/µs or 1,000 V/µs, designers can assume that the measured surge impulse voltage indicates that there is a correlation between the different voltage ranges, but not between each individual GDT.
The relationship is directly proportional to the measured DCBD series voltage rating of the device. Designers can then conclude that the surge impulse voltage and ramp impulse voltage is defined by the voltage and its rate of rise across it. The DCBD voltage selection can also be used to provide a good indication of the expected surge impulse voltage.
The ratio of DCBD voltage to surge impulse voltage for each voltage family is approximately 1.12:1 for the 10/1,000-type surge as shown by the slope of the approximation line in Fig. 1 . The typical 10/1,000 surge impulse voltage from the DCBD voltage can be (approximately) calculated as:
VSURGE(10/1,000 µs) = (1.2 x VDCBD ) + 170
Note : This formula is useful for DCBD voltages of 150 V or more.
fapo_Bourns01_aug2009
Fig. 1. The surge impulse voltage during 1 kV, 100 A 10/1,000 µs.
At Bourns, we have conducted several tests of our GDT offerings and although a 10/250-µs waveform has not been used for comparison, it is likely to provide a similar result to the 10/1,000 surge because it has the same rise time. During testing, a faster rising edge 2/10-µs surge yielded a higher surge sparkover voltage, but the difference between the 2/10 µs and 10/1,000 µs was just 7% and the 1.2/50-µs (8/20-µs) surge had nearly identical impulse performances to the 2/10 µs. Hence, the 10/1,000 formula can be adapted to also include faster rising edge surge waveforms as indicated below:
VSURGE = (1.2 x VDCBD ) + 280
Understanding let-through voltage
During testing it was important to ensure that production and test variations were taken into account so units were selected from different batches of the same voltage series and surged on two separate 100-A 10/1,000 generators. Fig. 2 below shows that there is similar performances between the 100-V/µs impulse voltage and the 100-A 10/1,000-µs surge impulse voltage. It also portrays the results plotted on the same curve shown in Fig. 1 with the addition of the 100-V/µs ramp impulse curve.
fapo_Bourns02_aug2009
Fig. 2. Variation of tests with 100-A 10/1,000-µs surge.
As a result of this test, the distribution of the surge impulse voltage should be increased a bit to provide a better safety margin in the calculation. The revised formula is:
VSURGE = (1.3 x VDCBD ) + 280
Calculating VSURGE under extreme surge conditions
The next test that was conducted was a Bourns GDT tested with a high current (20-kA) 8/20-µs surge current to determine the surge impulse voltage during extreme telecom surges. Figure 3 shows that the surge impulse voltage developed across the GDT started to decline after 800 A with an open circuit voltage of 1,984 V (800 A x 2.48 Ω = 1,984 V). The 2/10-µs, 10-Ω generator was also used as a comparison where its peak surge impulse voltage occurred with an open generator voltage of 1,700 V with a similarly shaped curve.
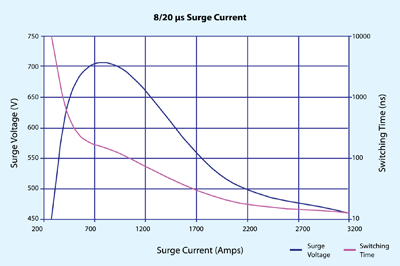
Fig. 3. Surge voltage versus generator short circuit current
The results of this test shows that the most difficult scenario in extreme conditions applied to the secondary protection or equipment is when the GDT experiences a 2-kV 2/10-µs or 8/20-µs surge. Increasing the generator voltage past this point could actually reduce the surge impulse voltage.
Figure 3 also shows the switching time of the GDT during a surge so that the expected let-through energy can be found. The switching time can also be used in propagation delay techniques (line length vs. delay) where a length of cable between the primary and secondary protection components helps to ensure coordination.
Examining arc voltage
The arc voltage (VARC ) is developed across the GDT during its virtual short circuit condition. This parameter defines the power dissipation of the GDT during its protection mode. A low arc voltage is desirable to keep power dissipation at a minimum, which in turn increases the life expectancy of the tube due to a lower operating temperature.
The miniature surface mount series GDTs are, in addition to other applications, being considered for secondary protection in broadband solutions, but require other considerations. For these types of applications, the overcurrent protectors need to be carefully selected to ensure that the GDT is bypassed correctly. If this is not performed correctly, the GDT could be damaged before the overcurrent protector operates under the ac power cross tests.
The arc voltage will also define how the primary and secondary protection solutions perform together. The principle is to have an overcurrent protector between the primary and secondary overvoltage protectors.
The belief is that once the GDT operates, the virtual short of the GDT will redirect the energy away from the secondary protection and the secondary will reset. It is common for a secondary protector such as a TISP thyristor to be used.
If the overcurrent protector solution is a fuse, it has been established that the fuse will need to clear before the GDT can operate if there is not enough impedance between the two voltage protectors. Resistance to achieve voltage coordination to allow the protection solution to reset is usually between 5 to 50 Ω, but is dependent on whether the secondary protector can withstand current capability.
The current through the TISP thyristor has to fall below its holding current, IH (150 mA min at an ambient temperature of 25C) for it to reset to a high-impedance state. The TISP thyristor on-state voltage, VT is approximately 3 V (dependent on surge current and impulse shape), so with a 50-Ω series resistance, the arc voltage must be lower than 10.5 V (0.15 x 50 + 3). Lower resistance values compound the problem. Having a higher arc voltage GDT will increase the stress for the secondary protection where a ceramic positive temperature coefficient (CPTC) thermistor would help in this instance.
To decrease the chances of under or over-engineering secondary surge protection, it is critical for designers to understand the dynamic parameters involved when selecting a GDT to withstand intense electrical surges. It is important to predict the expected peak voltage of a surge in order to provide an accurate method of identifying the GDT let-through voltage during highly volatile conditions.
The let-through pulse of a GDT helps designers predict what energy the secondary protection might experience and the arc voltage helps to define how the primary and secondary protection solutions should work together. This information helps engineers best protect sensitive telecom equipment with a GDT properly selected to withstand extreme surges such as lightning strikes and storms. ■
Advertisement
Learn more about Bourns


