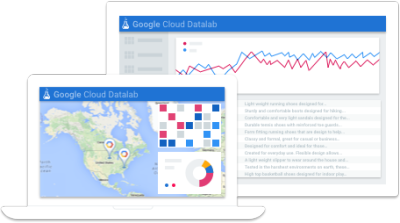
Google launched Cloud Datalab, a new powerful interactive tool for exploring, analyzing, and visualizing data with a few clicks. The service is intended to help developers “get insights from raw data and explore, share, and publish reports in a fast, simple, and cost-effective way,” the company said.

Cloud Datalab uses Jupyter notebooks (previously known as IPython), a format that allows users to create documents with live code and visualizations. As Jupyter is well-known in the data science world and has a thriving ecosystem built, it should make Google’s service simple to get started.
Developers can explore, visualize, and process data that sits in Google BigQuery, Compute Engine, and Cloud Storage while using the Cloud Datalab. To do so, they may use Python, SQL, or JavaScript and then use the data to build pipelines for deployment to BigQuery or create machine learning models, for example. To visualize the data, developers would use Google Charting or the matplotlib Python library.

In order to get started, the user must launch Cloud Datalab as an App Engine application. This is where the cost for using the product will come in after the free beta period ends, but Google has yet to release pricing information. After that, the user can start a new project and set up new notebooks – the service will also come with a few preinstalled notebooks to get started.
What’s most interesting about Cloud Datalab is that it’s an open source for developers who want to extend, simplify, or submit pull requests off GitHub.
As it currently stands, Google is neither billing this service as “business intelligence” nor is it gearing Cloud Datalab towards non-technical users.
Via TechCrunch
Advertisement
Learn more about Electronic Products Magazine


