Lead-acid batteries are generally used in automotive, motive and stationary applications. It is critical to continuously monitor and report the battery’s state of charge (SoC) and state of health (SoH). This article discusses in depth why accurate monitoring of these battery parameters is essential and how that monitoring will benefit end users. The technology used to calculate these parameters is also explained.
Lead-acid batteries have been in vogue since 1859 and are still popular due to their rugged design, lower cost and better recycling infrastructure [1]. They have been the battery of choice for automotive application such as starting-lighting-ignition (SLI) and for motive applications such as boats, forklifts and golf carts that involve deep discharge. With the proliferation of data servers and remote wireless base stations, battery backup has become indispensable — and again lead-acid batteries have been the preferred choice. In all of these applications, it is essential to monitor and report the battery’s state of charge (SoC) and state of health (SoH) instead of just monitoring the battery terminal voltage. For battery backup applications, it is critical to know whether the battery can deliver the required power when called upon for service since the impact from loss of mission-critical data or wireless coverage would be significant.
State of charge and state of health
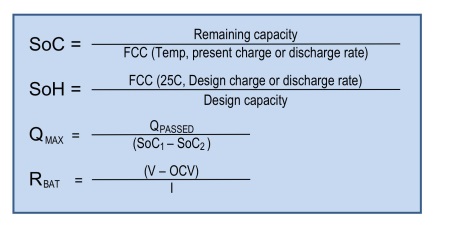
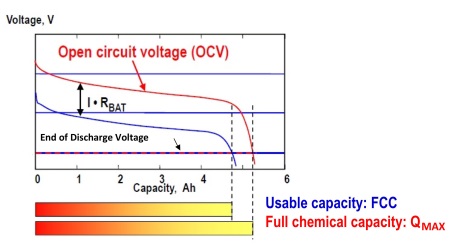
State of charge (SoC) of a lead-acid battery, expressed in %, is the ratio of the remaining capacity (RC) to the full charge capacity (FCC) (see Fig. 1 ). FCC is the usable capacity at the present charge or discharge rate and temperature. FCC is derived from battery full chemical capacity (QMAX ) and battery impedance (RBAT ) (See Fig. 2 ). For example, for a new lead-acid battery of 100 Ah design capacity, when it is fully charged, the SoC is 100% since the FCC is 100 Ah and RC is also 100 Ah. If that new battery is discharged so that RC is 70 Ah, then the SoC is 70%. As the battery ages, its full chemical capacity (QMAX ) tends to be lower than the design capacity due to chemical degradation. SoH monitors this chemical degradation and is reported in % as the ratio of the FCCH to the design capacity, where FCCH is FCC at 25°C for design charge or discharge rate (Fig. 1 ). For example, if the battery with design capacity of 100 Ah has a FCCH of only 85 Ah after one year in use, then its SoH is 85%. In short, SoC indicates how much charge is left before a recharge is needed, while SoH indicates when a battery will have to be replaced.

Fig. 1: How SoC, SoH, QMAX and RBAT of a battery are calculated

Fig. 2: Full charge capacity (FCC) is derived from QMAX and battery impedance RBAT
Limitations of using terminal voltage for SoC
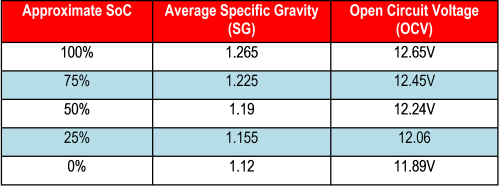
While it is easy to measure and monitor the battery terminal voltage, unfortunately, this is not a true indicator of the battery’s SoC and SoH, due to the effects of charge/discharge current and temperature. The biggest impact comes from the chemical kinetics during charge and discharge of the battery. To get a reasonable estimate of the SoC from voltage measurement, the battery needs to rest for at least few hours (for example, four hours) to attain equilibrium before the open circuit voltage (OCV), in other words, no-load voltage, can be measured. See Table 1 for the Battery Council International (BCI) recommended values for a 12-V lead-acid starter battery [2]. While an approximate SoC can be assessed at rest state, it is not possible to continuously assess it during charge and discharge by voltage measurement. Also, it is not possible to assess SoH with just terminal voltage measurement since it does not fully reflect the impact from battery aging. Measuring specific gravity (SG) of the battery electrolyte is another approximation method that is applicable to the flooded lead-acid battery type. But this method also suffers from lack of SoH information, from limitations due to temperature effects, stratified electrolyte concentration, and from the need for the electrolyte to stabilize before taking the SG reading.

Table 1: BCI standard for SoC estimation of a starter battery with antimony. Readings taken at 26°C and battery rested for 24 hours after charge or discharge. [2]
Given the limitations of the above methods, there is a need for a battery management system (BMS) solution that can automatically make the required measurements and report both SoC and SoH accurately. TI’s bq34z110, the latest lead-acid gas gauge, uses Impedance Track gauging technology to accurately monitor and report SoC and SoH of the battery [3].
Accurately monitoring SoC and SoH
Both SoC and SoH of the battery can be monitored by accurately measuring: battery voltage, battery temperature, and the charge into and out of the battery. When the battery is in rest mode and when the current is below a user chosen threshold, the SoC is determined using the measured battery voltage and a predefined OCV to SoC relationship table that is temperature compensated and unique to that battery type and chemistry [4]. During charge and discharge, the SoC is continuously calculated using FCC and RC while the SoH is calculated using FCCH and design capacity.
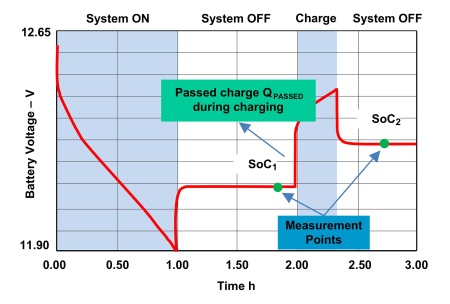
Both the SoC and SoH calculations depend on an accurate estimate of QMAX and battery impedance (RBAT ). QMAX is estimated when the battery is in the rest state. The corresponding equation is QMAX = QPASSED / (SoC1 – SoC2 ), where QPASSED is the passed charge between SoC1 and SoC2 , and SoC1 is fully rested SoC before charge/discharge activity and SoC2 is fully rested SoC after charge/discharge activity (Fig. 3 ). Once the QMAX is calculated, the same value is used to calculate SoC and SoH during charge/discharge state until the next QMAX update is done. Similarly, RBAT is estimated using the equation RBAT = (V–OCV) / I, where V is battery voltage, OCV is the open circuit voltage, and I is charge/discharge current. As the battery ages, its QMAX drops and RBAT increases. The Impedance Track algorithm tracks both to accurately report SoC and SoH.

Fig. 3: QMAX depends on SoC at rest before and after a charge (or discharge) and the Passed Charge QPASSED
By monitoring SoC and SoH of the lead-acid battery using Impedance Track gauging, it is possible to provide a better user experience by continuously and accurately reporting the remaining charge, and also by cautioning when a battery needs to be replaced. This also helps to avoid loss of server data, a wireless outage, or a stranded passenger.
References
1. Battery Council International, Lead Acid Batteries: http://batterycouncil.org/?page=Lead_Acid_Batteries
2. Battery University, How to Measure State-of-Charge website: http://batteryuniversity.com/learn/article/how_to_measure_state_of_charge
3. Download the BQ34Z110 datasheet: http://www.ti.com/product/bq34z110
4. Impedance TrackTM Gas Gauge for Novice, Application Report (SLUA375), Texas Instruments, Jan 2006: http://www.ti.com/lit/an/slua375/slua375.pdf
About the Author
Rajakrishnan (Raj) Radjassamy is the Business Development Manager for TI’s Battery Management Solutions where he supports battery monitors, gas gauges and protectors. Raj received his Ph.D in Computer Engineering from the University of Arizona, Tucson. With nearly two decades of engineering experience, he has been awarded nine patents, with another six in review. Raj can be reached at .
Related Products: Batteries
Advertisement
Learn more about Texas Instruments


