Lossless power monitoring increases efficiency
Manage a load’s electrical and thermal characteristics and optimize throughput and performance
BY RICHARD KROEGER
International Rectifier
El Segundo, CA
http://www.irf.com
Data centers accounted for approximately 1.5% of total U.S. electricity consumption in 2006[1]. Server requirements have more than doubled since 2000. The energy associated with every watt-hour of electricity used by the IT equipment and its voltage-regulating support must be removed, at almost equal energy expense, by a high-capacity cooling system. As a result, tough targets have been set to drastically reduce the amount of energy they consume.
New philosophies need to be applied at the system level to meet these tough new energy use targets. Only a minor portion of the total energy loss occurs at the voltage regulators, and therefore only minor improvements are possible.
One example of a new philosophy is system-level CPU clock throttling that controls the MIPS throughput as well as device power dissipation. The device performance and peak temperature can both be optimized when the CPU is restricted to a closed loop maximum power diet.
Another philosophy is to ration the total available power according to a schedule that yields the most return on power investment. Both of these philosophies can be applied to other subsystems such as memory, communication, and graphics.
Because system level loads have an unpredictable power profile due to rapid changes in the required performance and function power must be measured rather than assumed. By dynamically monitoring power, the system can accurately predict thermals at various subsystems and time. With this intelligence, the system can manage the load’s electrical characteristics to limit its power and establish the correct cooling conditions in advance so that the load does not leave its required thermal envelope, optimizing its throughput and hence its performance.
The design challenges
Many challenges must be overcome when measuring power. Voltage and current must be measured simultaneously, multiplied, and the product averaged over an interval of interest.
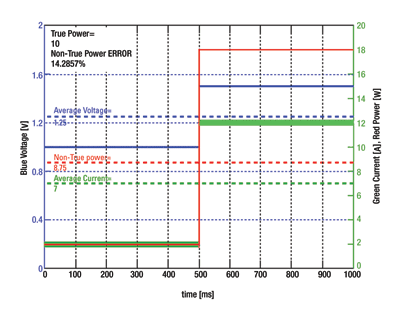
Figure 1 shows a dynamic waveform example that demonstrates a true power 14% higher than average current multiplied with average voltage. The example waveform repeats every second. The solid blue voltage waveform steps from 1 to 1.5 V and back at 500-ms intervals and has an average potential of 1.25 V, shown as a dashed blue line. The solid green current waveform steps from 2 to 12 A and back with an average current of 7 A, and is shown as a dashed green line.
It is tempting to simply multiply these two averages together for (1.25 V * 7 A) = 8.75 W, shown in dashed red. However, the real or true power is
P = [1/T] ∫0 v(t) i(t)dt = 10W
as is shown by the average of the solid red power waveform.

Fig. 1. Non-true power comparison.
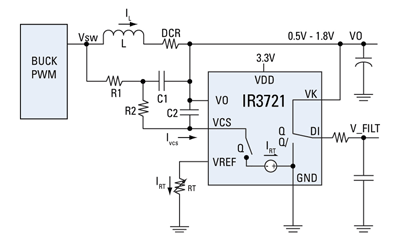
However, a new solution addresses these challenges. The IR3721 power monitor IC generates a pulse-width-modulated signal at its DI output with a duty ratio proportional to inductor current and an amplitude equal to the voltage connected to its VK pin. When this signal is filtered with an RC filter, the analog output is proportional to power.
Defining the challenges
To measure current without generating additional losses, existing components must be pressed into dual service. The objective of a switching power supply is to avoid voltage drops in a path carrying high current. Nevertheless, inductors are wound with slightly resistive copper wire and can be modeled as an ideal inductor in series with a dc resistance (DCR).
In considering Fig. 2 , there are four challenges. (1) The terminals of the lumped DCR element internal to the inductor are not available for voltage sampling. (2) The normal operating voltage across the structure is a huge rectangular waveform obscuring the much smaller DCR voltage of interest. (3) The DCR of the copper wire changes with temperature. (4) And an accurate multiplier is required.

Fig. 2. Buck converter with IR3721
Generating the current signal
Referring again to Fig. 2, the new device will sink just the average current required to maintain C2 discharged. When the voltage at VCS equals the voltage at VO two equations are valid.
VSW VO =IL DCR (1 + S [L/DCR])
and
VSW VO =IR2 (R1 + R2) (1 + s((R1 R2)/(R1 + R2))C1)
Inductor current can be solved in terms of the remaining variables.
IL = IR2 (R1 + R2)/DCR) (1 + s((R1 R2)/(R1 + R2))C1)/(1 + s (L/DCR))
If component values are chosen such that the numerator and denominator terms of s (the time constants) in the equation above are equal then dynamic factors cancel and the equation can be simplified to
IL = IR2 [(R1 + R2)/DCR]
The first two challenges have now been met. Even though the DCR terminal voltage is not available in the lumped element inductor IL can still be known by measuring IR2 and knowing the component values of R1, R2, and DCR.
The second challenge is that the DCR voltage is indeed small. However, the new device measures average R2 current by using a switched current sink to maintain voltage equality with VO. An internal oscillator sinks an amount of current IRT while on, and no current when off. The two states are determined by an internal comparator with an output “Q” while observing inputs VO and VCS . IRT is established by loading the VREF pin with a resistor. The duty ratio of Q is proportional to inductor current.
The third challenge is that DCR changes with temperature. The DCR of an inductor wound with copper wire can be modeled with the equation DCR(T) = DCR(25°C) x (1 + 0.0039 x (T – 25)) when T is expressed in degrees C. The first challenge left us with the equation:
IL = IR2 ((R1 + R2)/DCR)
This equation can be embellished by realizing that average
IR2 = ((VRT /RT )DQ )
where DQ is the duty ratio of Q. Consider that RT could be made a function of temperature. We now establish that
IL = VRT • DQ (R1 + R2)/[RT (T) • DCR(25) • (1 + 0.0039) • (T – 25)]
If over a temperature interval of interest an NTC thermistor network could be synthesized to have a resistance of
RT (T) = RT (25C)/(1 + 0.0039(T – 25))
then temperature compensation would be achieved and
IL = VRT • DQ (R1 + R2)/[RT (25) DCR(25)]
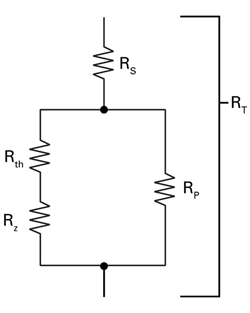
A typical thermistor compensator network may take the form of Fig. 3 . The resistance of the thermistor itself is modeled by the equation
Rth (T) = Rth (T0 ) • e(ß((1/T) – (1/T0)))
where T is expressed in degrees Kelvin. Thermistor manufacturers usually establish To to be 25C. The thermistor Beta and initial resistance R(To ) are established at the time of manufacture by the material used in construction and thermistor physical size.
Although perfect compensation over all temperatures is not achievable, better than 1% over an interval of interest is. The thermistor itself will exhibit too much curvature for proper compensation, but the constant-valued resistors comprising the rest of the network will tend to linearize the RT (T) versus temperature function.

Fig. 3. Thermistor compensator network
Multiplying the voltage signal
A bilateral switch internal to the new device connects output pin DI to pin VK when Q is high, and to GND when Q is low. The rectangle generated has a duty ratio proportional to current and an amplitude equal to VK. If VK is connected to a constant voltage then average DI output is proportional to current. If VK is connected to the output voltage then average DI output is proportional to power.
Filtering the result
Although the average of the rectangle generated above is proportional to power (current), the signal is unnecessarily hard to process. An RC filter that restricts fundamental frequency ripple but passes power information at the highest frequency of interest at its output is employed to complete the original challenge of power measurement. Multiple pole filters are also an option if more ripple attenuation is desired at frequencies just above the maximum frequency of interest. ■
For more on lossless power monitoring, visit http://www2.electronicproducts.com/Power.aspx.
Advertisement
Learn more about International Rectifier


