For SSL, designers need to understand goniophotometry to measure spatial luminous intensity distribution
BY RALF ZUBER, WOLFGANG DÄHN, and BOB ANGELO
Gigahertz-Optik, Newburyport, MA
http://www.led-measurement.com
The measurement of the spatial luminous intensity distribution of different types of light sources — including solid-state lighting (SSL) like LEDs — is important in lighting design and quality control. Everything from automotive headlamp design to technical plans for lighting rooms or parking lots is based on this data. In some specialized medical applications, like light therapy, the light beam profile must also be known to design for effective targeting and dosimetry.
For such measurements, goniophotometers (from the Greek “gonia,” an angle; “photos,” light; and “metron,” measure) have been used by traditional lighting manufacturers for some time. For the most part, however, this is unfamiliar technology to a new generation of solid-state-lighting and optical engineers.
So it is useful to review goniophotometric principles, measurements, and data analysis to point out measurement advantages and limitations, and all the parameters of technological interest. In the following sections, this is done using measurements taken on two types of light sources that employ different optics to produce different beam shapes. The measurement parameters and important procedural steps — for example, the alignment of the light source and obtaining the best measurement resolution — are explained, and interpretation of measurement results are discussed extensively, to elucidate measurement principles.
Spatial distribution data
Spatial distribution data can show the light beam profile in both 2D and 3D geometries. This is important for any application where a particular light shape is required. Measured data also lets designers compare light sources from the same product line, thus providing an essential quality control tool. Furthermore, the data permits very exact calculation of the total luminous flux.
Measurement priorities often differ depending on the application. In research and product development, the focus is on obtaining high-resolution data to design and build light sources that radiate perfectly in the desired direction. In other applications, like quality control in mass production, measurement time and reproducibility are the dominant factors, so a few distinct data points may suffice rather than the entire shape of radiation profile.
In many instances, these differences call for a very flexible measurement system, one whose built-in capabilities and features enable it to be modified according to the specific application. To meet these measurement demands, 3D photometric goniometers (goniophotometers) are a good choice.
The measurement principle
The principle of a goniometric measurement is to measure the complete luminous intensity distribution of a light source. To accomplish this, many discrete measurement points on the surface of an imaginary sphere around the light source are measured. As a result, the whole radiation pattern of the light source can be very closely approximated.
The resolution of the measurement points dictates how close the goniometery matches the actual light source spatial distribution. So the number and position of the measurement points are critical for accurate results. The radius of this imaginary sphere is the difference between light source (lamp) and receiver (detector). By changing the distance between source and receiver, the light source’s near- and far-field characteristics can be studied.
To reach every point on this imaginary sphere, a goniometer usually works with two axes like the type B goniometer used for the measurements in this article (see Fig. 1 ). One axis (θ) rotates between −180° and 180°; the other axis (ϕ) swings between –90° and 90°. Every point on the imaginary sphere around the light source can be reached and measured.
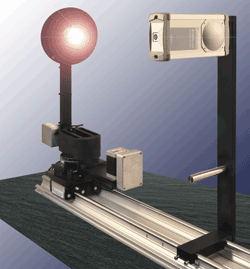
Fig. 1. A type B goniophotometer is typically set up as shown here.
Other common types are type C goniometers that rotate between 0° and 360° on one axis and between 0° and 180° on the other. Similar systems like the type A goniometer are not very common.
Mechanical choices
Goniometers of more than one type of mechanical design — including moving-mirror, gimbal-mounted, and compact — can be used to get the full range of motion required for collecting measurements. Moving-mirror goniometers are technically complex and very expensive, and their large footprint requires a lot of lab space. Gimbal-mounted goniometers also need a lot space in all three directions, because the detector drives around the lamp, which is stationary. Both types of instruments can, however, gather data rapidly.
The compact goniometer needs only as much space in one direction as the required maximum measurement distance. To reach all points over the entire sphere, the light source is rotated on two axes. For measuring LEDs and light sources of similar size, this type of photometric goniometer is often a good choice. At every angular point, the goniometer must stop for a few milliseconds to take a measurement. Thus, the number of measurement points, and therefore the resolution of the measurement, dictates the total measurement time.
A compact goniometer was used for this exercise. To analyze measurement results, several types of spatial plots can be produced. For example, the 3D plot provides a quick snapshot of the light source shape, while detailed polar layer plots can be made available for further studies.
Measurement routine
The measurement software needs to be able to cope with non-equidistant measurement routines which are necessary for effective measurements. The reason for this requirement can be seen by considering a simple example of a single LED measurement.
In the measurement, the radiation pattern of the LED is restricted to a small beam angle emitted from its tip. Since there is very little or no radiation emitted from its sides, only a few measurement points are needed there. But in approaching the main area of radiation near the LED tip, more and more points are required for maximum resolution in the focus area. A similar measurement with equidistant steps over the whole sphere will last much longer, but will not produce any better results.
So the magnitude of the measurement increment is very important. Therefore, the tolerances of the mechanical parts must always be considered; it makes no sense to measure in 0.001° steps in high-resolution areas when the mechanical parts only claim 0.1° accuracy.
A good rule of thumb is it to start with a rough scan needing fewer data points to get a first impression of the light source radiation pattern. This scan can then form the basis of a specific routine that can be developed by refining those areas where the shape exhibits large changes.
Every light source will have a near perfect measurement routine, but usually one routine will fit many light sources of the same type. For example, the light distribution of LEDs is very similar, so no additional routines would be needed.
In product quality applications, these measurement routines can easily be perfectly fit to the specific light source. This allows fast and very accurate surveillance of the important areas of the light source.
Data analysis
Novices often have trouble interpreting measurement results. The best way to understand the measured results is by studying different kind of plots, because interpreting the numeric data requires expertise or extra software tools. In quality control, it’s common for the software to be able to compare results online during the actual measurement, thus permitting fully automated production processes.
A good way to start analyzing data is to review the 3D beam plot. This review will give a rough outline of the light source’s spatial distribution and highlight the points of interest. For example, for an almost perfect lambertian-emitting LED, all important information is presented easily and quickly (see Fig. 2 ). The light is not radiating perfectly in the upper direction, which is recognizable by the crater in its shape. Only a practiced lighting engineer could perceive this from the data only without the plot.
For further studies, polar plots of different layers are a good choice. The 3D plot will pinpoint the most interesting areas to study on the polar plot, which speeds up the data analysis.
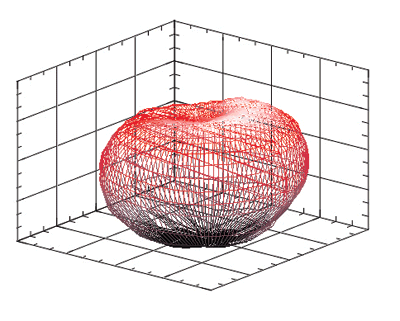
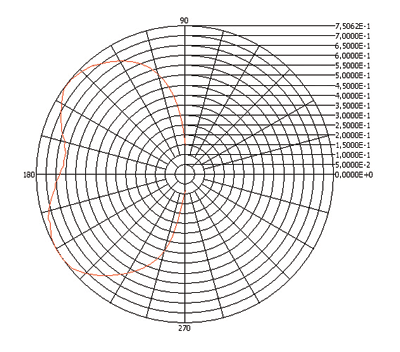
Fig. 2. The luminous intensity distribution measurement of an LED (top) can highlight points of interest, while the polar plot of one scan (bottom) permits detailed study of the light source’s characteristics.
When same LED is mounted with a reflector to focus the radiated beam, the measurements change significantly (see Fig. 3 ). The beam shape is no longer symmetrical, as in Fig. 2. Analyzing the beam in 3D plots give a good indication of the reflector’s properties, and the polar graph from a 2D perspective aids in detailed analysis.
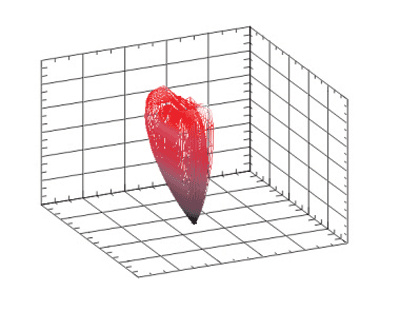
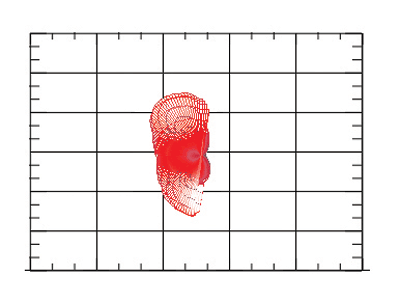
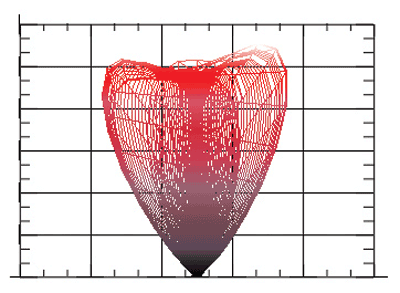
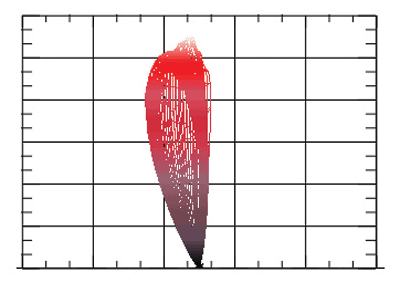
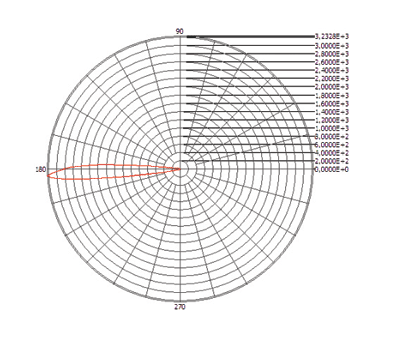
Fig. 3. The asymmetrical 3D plot (top) can be viewed in 2-D (middle three graphs) to better understand the reflector’s characteristic. The polar plot (bottom) using data from the 2-D plot next to it gives even more detail.

Fig. 4. The actual picture of the light source described by the plots in Fig. 3 show how it conforms to expectations.
Thus, a designer will have an understanding of the light/reflector performance in reality (see Fig. 4 ), and be able to create designs that meet real-world requirements. ■
Advertisement
Learn more about Gigahertz-Optik


