BY COLIN WALLS, Embedded Software Technologist, Mentor Graphics, www.mentor.com/embedded-software Y
An embedded system typically has enough CPU power to do the job, but typically only just enough — there is no excess. Memory size is usually limited. It is not unreasonably small, but there isn't likely to be any possibility of adding more. Power consumption is usually an issue and the software — its size and efficiency – can have a significant bearing on the number of watts burned by the embedded device.
It is clear that it is vital in an embedded system that the real time operating system (RTOS) has the smallest possible impact on memory footprint and makes very efficient use of the CPU.
RTOS metrics
There are three areas of interest when looking at the performance and usage characteristics of an RTOS:
- Memory – how much ROM and RAM does the kernel need and how is this affected by options and configuration?
- Latency, which is broadly the delay between something happening and the response to that occurrence. This is a particular minefield of terminology and misinformation, but there are two essential latencies to consider: interrupt response and task scheduling.
- Performance of kernel services. How long does it take to perform specific actions?
A key problem is that there is no real standardization. One possibility would be the Embedded Microprocessor Benchmark Consortium, but that does not cover all MCUs and, anyway, it is more oriented towards CPU, rather than MPU, benchmarking.
Memory footprint
As all embedded systems have some limitations on available memory, the requirements of an RTOS, on a given CPU, need to be understood. An OS will use both ROM and RAM.
ROM, which is normally flash memory, is used for the kernel, along with code for the runtime library and any middleware components. This code – or parts of it – may be copied to RAM on boot up, as this can offer improved performance. There is also likely to be some read only data. If the kernel is statically configured, this data will include extensive information about kernel objects. However, nowadays, most kernels are dynamically configured.
RAM space will be used for kernel data structures, including some or all of the kernel object information, again depending upon whether the kernel is statically or dynamically configured. There will also be some global variables. If code is copied from flash to RAM, that space must also be accounted for.
There are a number of factors that affect the memory footprint of an RTOS. The CPU architecture is key. The number of instructions can vary drastically from one processor to another, so looking at size figures for, say, PowerPC gives no indication of what the ARM version might be like.
Embedded compilers generally have a large number of optimization settings. These can be used to reduce code size, but that will most likely affect performance. Optimizations affect ROM footprint, and also RAM. Data size can also be affected by optimization, as data structures can be packed or unpacked. Again both ROM and RAM can be affected. Packing data has an adverse effect on performance.
Most RTOS products have a number of optional components. Obviously, the choice of those components will have a very significant effect upon memory footprint.
Most RTOS kernels are scalable, which means that, all being well, only the code to support required functionality is included in the memory image. For some RTOSes, scalability only applies to the kernel. For others, scalability is extended to the rest of the middleware.
Measurement
Although an RTOS vendor may provide or publish memory usage information, you may wish to make measurements yourself in order to ensure that they are representative of the type of application that you are designing.
These measurements are not difficult. Normally the map file, generated by the linker, gives the necessary memory utilization data. Different linkers produce different kinds of map files with varying amounts of information included in a variety of formats. Possibilities extend from a mass of hex numbers through to an interactive HTML document and everything in between. There are some specialized tools that extract memory usage information from executable files. An example is objdump .
Interrupt latency
The time related performance measurements are probably of most concern to developers using an RTOS. A key characteristic of a real time system is its timely response to external events and an embedded system is typically notified of an event by means of an interrupt, so interrupt latency is critical.
Unfortunately, there are two definitions (see Fig. 1) , at least, of “interrupt latency”:
- System: the total delay between the interrupt signal being asserted and the start of the interrupt service routine execution.
- OS: the time between the CPU interrupt sequence starting and the initiation of the ISR. This is really the operating system overhead, but many people refer to it as the latency. This means that some vendors claim zero interrupt latency.

Measurement
Interrupt latency is the sum of the hardware dependent time, which depends on the interrupt controller as well as the type of the interrupt, and the OS induced overhead.
Ideally, quoted figures should include the best and worst case scenarios. The worst case is when the kernel disables interrupts. To measure a time interval, like interrupt latency, with any accuracy, requires a suitable instrument and the best tool to use is an oscilloscope. One approach is to use one pin on a GPIO interface to generate the interrupt and monitor it on the 'scope. At the start of the interrupt service routine, another pin, which is also being monitored, is toggled and the interval between the two signals may be easily read.
Scheduling latency
A key part of the functionality of an RTOS is its ability to support a multi-threading execution environment. Being real time, the efficiency at which threads or tasks are scheduled is of some importance and the scheduler is at the core of an RTOS. It is hard to get a clear picture of performance, as there is a wide variation in the techniques employed to make measurements and in the interpretation of the results.
There are really two separate measurements to consider:
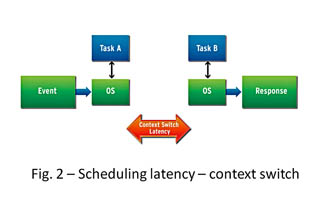
- The context switch time
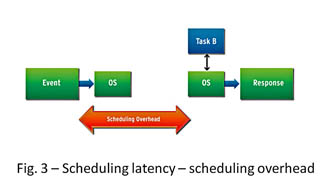
- The time overhead that the RTOS introduces when scheduling a task

In Fig. 2, we are looking at the elapsed time between the last instruction from task A being executed and the first instruction from task B. It is unlikely to make any difference whether Task B has been run before and was paused or it is being run for the first time.

The other scenario is when the RTOS is idling and an external event causes the RTOS to schedule a task. In this case, the overhead is the elapsed time before the required task is actually running, as shown in Fig. 3.
Measurement
The scheduling latency is the maximum of two times: ƮSO, the scheduling overhead; the end of the ISR to the start of task schedule and ƮCS, the time taken to save and restore thread context.
Measurements may be made in a similar way to the interrupt latency timings.
Timing kernel services
An RTOS is likely to have a great many system service API (application program interface) calls, probably numbering into the hundreds. To assess timing, it is not useful to try to analyze the timing of every single call. It makes more sense to focus on the frequently used services.
For most RTOSes, there are four key categories of service call:
- Threading services
- Synchronization services
- Inter-process communication services
- Memory services
Advertisement
Learn more about Mentor Graphics


