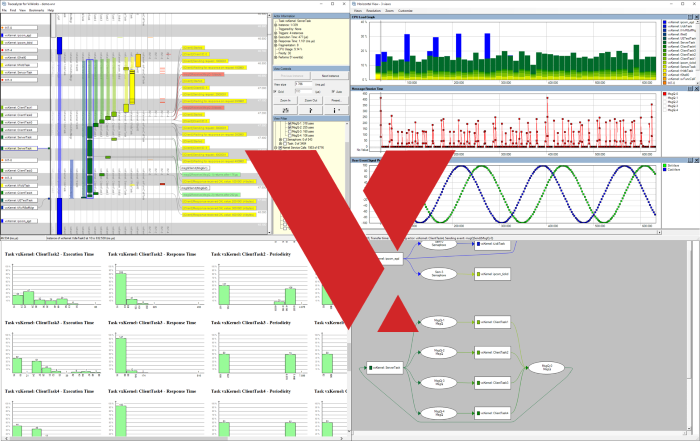
Percepio AB, the leading specialist in software tracing tools for real-time operating systems announced the release of Tracealyzer for VxWorks version 3.1.2, now available for download. Changes include several bug fixes and plenty of useful improvements, such as:
User Event Log
This view shows a text log of custom “User Events” that have been added in the embedded application code (much like “printf” call). We have now added new formatting options to allow for better display and text export. This view is opened by double-clicking on a yellow User Event labels in the main trace view, or from the View menu. 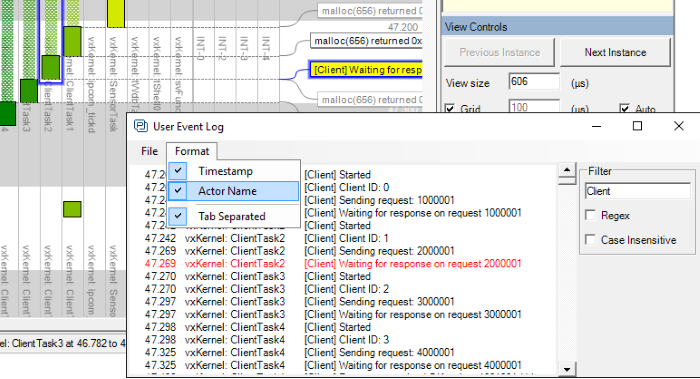
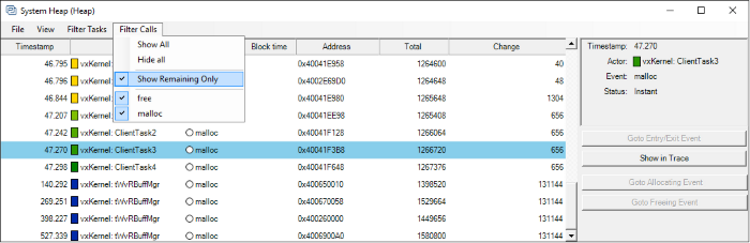
Filter for Memory Leaks
The Object History View shows all operations for each kernel object. It can be used to view dynamic memory allocation events and now allows for filtering out matching memory allocation events (malloc/free) with the new “Show remaining only” filter. This view is opened by double-clicking on a malloc or free event in the main trace view, or that category in the view filter.
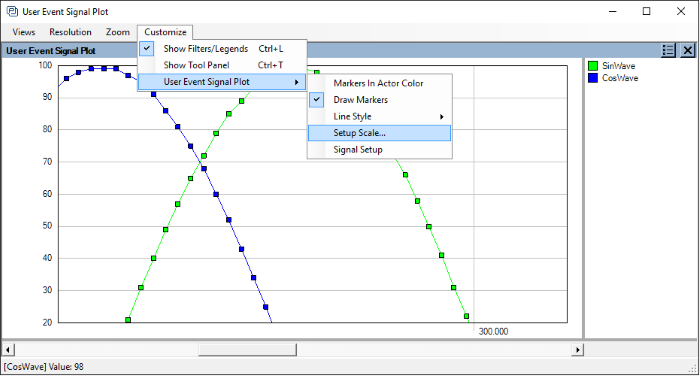
Customize the Y-scale
Apart from the vertical main timeline, Tracealyzer also provides a variety of horizontal graphs showing different aspects of the trace, like task response times and custom data plots. We have now added the option to adjust the Y-axis scale on all such “scatterplot” type graphs.
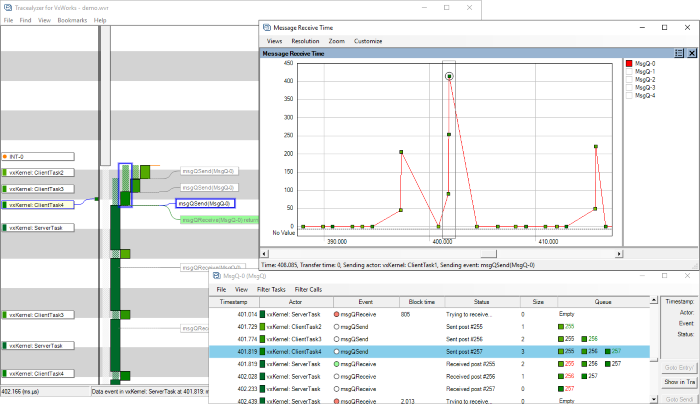
Message Receive Time
The message queue latency, i.e., time from “send” to “receive”, can be plotted for each message. This view is opened from Views -> Add in the horizontal view window.
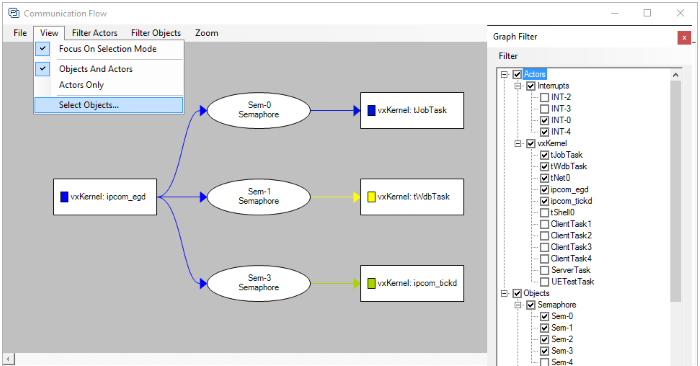
Communication Flow Graph
This dependency graph shows “who's talking to who”, i.e., how the tasks, ISRs and kernel objects interact in runtime. But for larger systems, showing all dependencies may yield a huge graph.
New filtering has been added to make the Communication Flow graph more useful for larger systems. The filter dialog is opened automatically before rendering the graph, if the graph is suspected to become large, but the filter can also be opened and edited from the menu.
The Tracealzyer for VxWorks tool is an RTOS trace debug solution that provides 25+ graphical runtime views that offer insight during debugging, validation, optimization, documentation and training. Tracealyzer for VxWorks can be downloaded at https://percepio.com/download/
Source: Percepio AB
Advertisement
Learn more about Electronic Products Magazine


