Phase-noise test options for wireless broadband
It pays to know how to measure jitter, a key performance metric of local oscillators in transmitters and receivers
By ERIC HAKANSON
Anritsu
Morgan Hill, CA
http://www.anritsu.com
The wireless communication industry is moving toward higher RF frequencies and data rates through more complex modulation and wider modulation bandwidths. Successful emerging broadband wireless systems must be supported by reliable measurement technology.
Critical measurements
Error vector magnitude (EVM) is a critical spec often used to describe a transmitted signal’s modulation quality. EVM measures the difference between an ideal, reference waveform and the measured waveform. If a receiver has a poor EVM, its ability to properly recover the transmitted signal is reduced, which increases the bit error rate (BER) at the edge of a cell, and thus reduces the area of coverage.
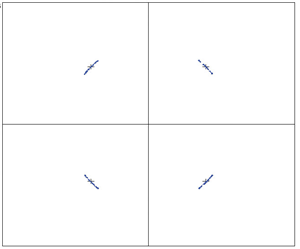
One of the contributors to poor EVM is the phase noise of all of the oscillators in the transmitter and receiver. Phase noise on a quadrature-phase-shift-keyed (QPSK) signal looks like a rotation of the constellation (see Fig. 1 ). This reduces the distance between the constellation points, and thus the receiver needs a higher signal-to-noise ration for a given bit-error rate. Thus, the phase noise reduces the receiver’s sensitivity.

Fig. 1. Phase jitter on a QPSK signal like the above reduces receiver sensitivity.
For orthogonal frequency division multiplexing (OFDM) signals, such as those used in LTE and WiMAX, phase noise from the local oscillator (LO) is superimposed on each of the n subcarriers. This phase noise has two effects: (1) random phase rotation for all subcarriers, often called common phase error (CPE), and (2) inter-carrier interference (ICI), caused by the corruption of a given subcarrier by its n – 1 noisy adjacent subcarriers.
OFDM symbols contain certain subcarriers, called pilots, which help the receiver track out the CPE, as well as estimate the frequency response of the transmission channel. The pilots do not help with the ICI, however, so it will still affect the EVM. This makes the effect of phase noise somewhat different for OFDM than for the traditional QPSK signal, but phase noise can still be a significant cause of signal degradation.
For a 64-QAM-modulated OFDM, EVM requirements at the transmitter output are very stringent: typically 2.7% rms. This is why the LO phase noise and jitter are critical for the design of an LO phase-locked loop (PLL). To achieve the 2.7% rms EVM, a total phase jitter lower than 1° rms has been suggested as a criteria for choosing a synthesizer.
Measuring phase noise
Since phase noise can have such a significant effect on EVM, verifying the phase noise performance of the LO during the development process is critical. While manufacturing-test times for low-cost devices such as user equipment or femtocells don’t allow for this kind of in-depth measurement, phase noise measurement capability is helpful for process monitoring and for troubleshooting manufacturing problems.
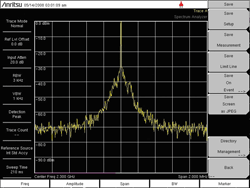
You can easily see phase noise on a spectrum analyzer by looking at the signal “skirts.” A fairly shallow slope with frequency shows phase noise (see Fig. 2 ). The spectrum analyzer plot doesn’t show how much jitter there is, however.

Fig. 2. This CW signal exhibits phase noise on its “skirts.”
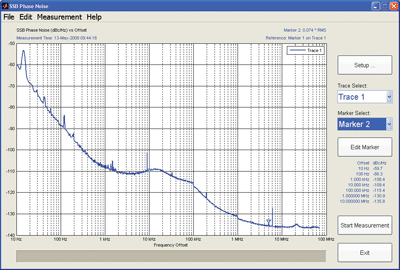
Modern spectrum analyzers can easily measure phase noise in dBc/Hz, or phase jitter in degrees, radians, or seconds. Measurement of phase noise with a spectrum analyzer is appropriate for moderate-quality synthesizers, such as are found in commercial wireless user equipment or femtocells, and possibly even in base stations. In the example here (see Fig. 3 ), a spectrum analyzer measured to have about 0.1° of jitter over the range of 10 kHz to 5 MHz on a 2.3-GHz signal is clearly more than adequate for measuring the LO.
A spectrum analyzer is not appropriate, however, for measuring very high quality synthesizers, such as laboratory-grade synthesized signal generators or atomic clocks. In such cases, the measurement would be of the residual phase noise floor of the spectrum analyzer, rather than of the device under test.
A spectrum analyzer is also of limited use when measuring drifting sources such as voltage-controlled oscillators (VCOs), because the VCO frequency drift can affect the measurement. At large offsets, such as >1 MHz, this is usually not a problem, but at small offsets such as 1 kHz, the VCO output will often drift out of the measurement span, invalidating the results.
Since phase noise is measured in dBc/Hz but the LO requirement is in degrees rms, some conversion is required, which involves integrating the phase noise over many decades of offset and converting to the correct units—degrees, radians, or seconds. While you could do this complex process manually, it is far simpler to let the instrument do this for you.
The offset-range question
But this raise a question: Over what range of offsets should the integration be done? A good rule of thumb for OFDM is to pick offsets from the symbol rate out to the system bandwidth. The limit at the symbol rate is because the CPE is removed by the receiver, and CPE is primarily at offsets less than the symbol rate. Offsets larger than the system bandwidth are filtered by the receive filter, and will have little influence.
For WiMAX, the exact offsets will depend on the specific profile being used, but one example might use offsets from 10 kHz to 5 MHz. For LTE, the principle is the same, but the offsets would be slightly different, and again depend on the mode that the radio will use. An example for LTE might be 15 kHz to 20 MHz.
The phase noise graph provides more than just a way to get the jitter over a specific frequency offset range; it’s also a tool for better understanding the PLL operation. If we examine the phase noise plot in Fig. 3, we see several distinct regions.

Fig. 3. In this example phase noise plot with jitter measurement from 10 kHz to 5 MHz offset, markers delimit the frequency offset range for the jitter measurement.
Offsets from 10 Hz to about 1 kHz and from about 100 kHz to 1 MHz have a fairly constant slope of 20 dB per decade. These are the regions where the resonant elements in the frequency reference and the VCO are dominant. From about 1 kHz to 10 kHz, we see a flat region, transitioning to the 20-dB/decade slope on either end. This is the broadband noise floor of the reference, when multiplied up to the RF frequency.
The PLL bandwidth is also in this region, probably near the high end of the range. Depending on the loop filter, there may be a large peak in this region, which indicates an underdamped condition that can cause instability problems. Above approximately 1 MHz or so of offset, we see the broadband noise of the VCO.
So using a spectrum analyzer and phase-noise-measurement software is an excellent way to verify the jitter performance of local oscillators. The combination will provide sufficient performance with low test cost, and can easily show jitter over a range of frequency offsets. ■
Advertisement
Learn more about Anritsu


