By Martin Rowe, senior technical editor, test and measurement, EE Times and EDN
Stability is important in analog and power circuits. Without stability, control loops can run out of control, leaving you with oscillations and other nasty realities. Power supplies, for example, need control loops to adapt to changes in load, input voltage, temperature, and so on. To measure stability in a control loop, you inject an error signal and measure the response.
Traditionally, you needed a vector-network analyzer (VNA) to measure the amplitude and phase response to an error signal and to view those measurements with a Bode Plot. With the frequency-response analyzer FRA Bundle($1,050) from Picotest, you can inject signals, measure the response, and produce a Bode Plot with an oscilloscope.
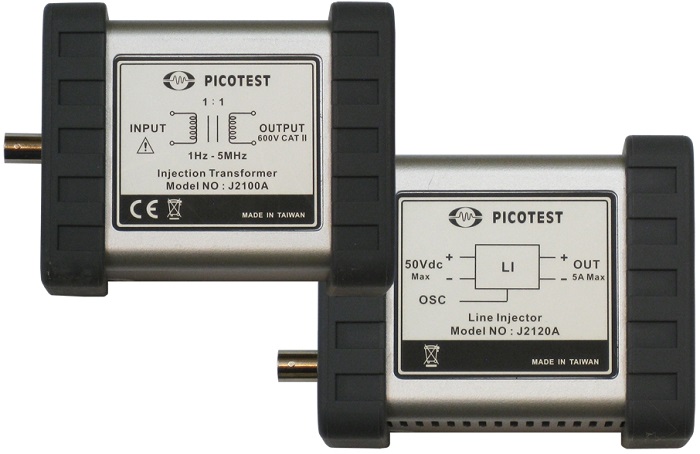
The bundle consists of the J2100A, a 10-Hz to 5-MHz injection transformer for injecting the error signal into a control loop (Fig. 1 ). The bundle also includes a J2120 line injector, which lets you measure power-supply rejection ratio (PSRR), something that you can’t do with the J2100A because of the control-loop signal’s DC component.

Fig. 1: The Picotest FRA bundle consists of an injection transformer and line injector.
You can use the FRA Bundle with the following oscilloscopes:
- Keysight InfiniiVision X-Series
- Rohde & Schwarz RTM, RTA, and RTB series
- Siglent SDS1000X-E-FG series
- Tektronix 5 series or 6 series
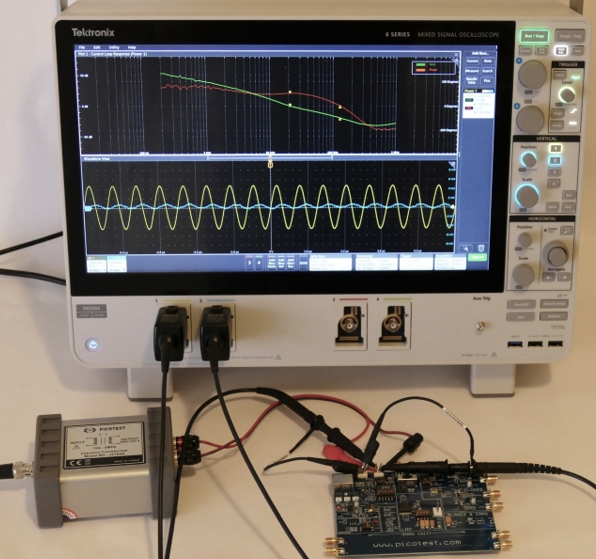
Fig. 2 shows the J2100A in a typical test setup.

Fig. 2: A typical test setup with a J2100A injection transformer connected to a test board and oscilloscope.
Stability test software
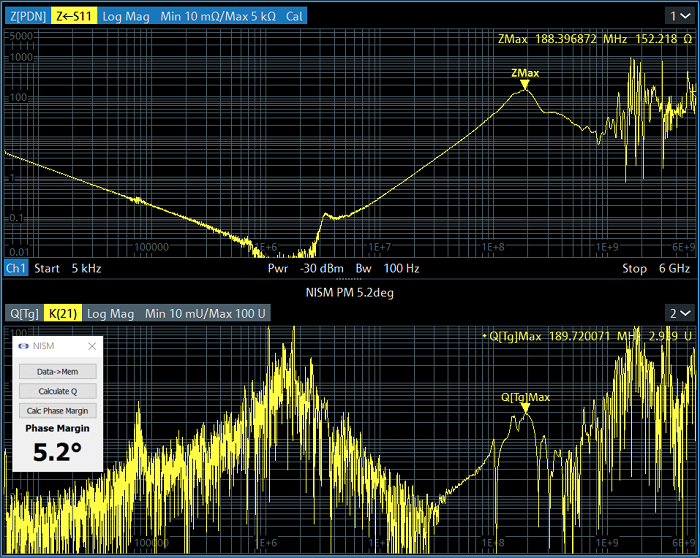
Picotest has also introduced software ($795) that lets you use a Rohde & Schwarz ZNL or ZNLE VNA to make non-invasive stability measurements. Previously available for the Omicron Labs Bode 100 and Keysight E5061B and E5071C, the software adds non-invasive stability margin (NISM) measurements for voltage references and regulators, switching amplifiers, op amps, and power converters when the control loop is inaccessible. The software uses the VNA to make a one-, two-, or three-port impedance measurement and then uses group delay to calculate phase margin. Fig. 3 shows amplitude and phase measurements from a one-port test setup.

Fig. 3: Software for Rohde & Schwarz VNAs measures stability derived from impedance measurements.
Related articles:
Advertisement
Learn more about Electronic Products Magazine


