Selecting the right instrumentation for RF device characterization accelerates test speed and produces accurate results
BY TIM CULLIGAN
Aeroflex Test Solutions
Plainview, NY
http://www.aeroflex.com
The specification known as PCI eXtensions for Instrumentation (PXI) provides a standardized modular form factor for use in measurement and automation systems. RF test-and-measurement equipment has been developed that combines RF signal generation and analysis capabilities with the PXI standard to produce fast, accurate test equipment. Scalable PXI based systems can provide small-footprint low-cost test solutions that are extremely appealing to RF device manufacturers around the world.
Since PXI modules are connected to the common PCI bus, the hardware connection is analogous to that of peripheral cards in a PC. Benefits of this arrangement include high-speed communication between module and host processor, as well as the ability to easily upgrade test speed as advances in PCs become available.
Putting PXI to work
A prime example of a test application that suits PXI modules has to do with testing the modulation quality of vector-modulated signals from the output of amplifier circuits used in digital communications.
Amplifiers used to transmit vector-modulated signals must provide acceptable error vector magnitude (EVM) performance over a specified range of power levels and frequencies. So characterization of EVM performance is needed to ensure proper amplifier-circuit operation in digital communication applications.
When performing amplifier EVM characterization, it may be necessary to make EVM measurements at a number of incremental power level steps and then verify that each measured value falls within a specified range. Graphical presentation of EVM versus output power makes it easy for the designer or test engineer to see the EVM performance of a particular device over a range of power levels.
As an amplifier’s output power increases toward its gain compression point, the corresponding EVM performance can be degraded due to nonlinearity. Characterizing this behavior is an important part of the design process: the information allows users of the device to select their operating point.

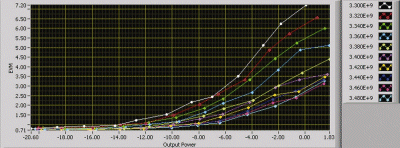
Fig. 1. Here , amplifier EVM versus output power is plotted iteratively at 10 frequency steps.
Plotting EVM versus output power at a number of frequency steps graphically illustrates the device behavior (see Fig. 1 ) For this family of EVM versus output power curves, the bold dots on each curve represent measured output power values in dBm, versus their corresponding EVM values shown in percent.
Each plot is relatively flat or rises slightly from left to right as the amplifier’s output power is increased within its specified operating range. Once the amplifier’s output power nears its gain compression region, the curve rises sharply.
To produce such a family of curves requires a very large number of iterative measurements. Depending on the method and the equipment used, this data collection and calculation can take a lot of time.
PXI solution
RF modular PXI instruments configured for this application have proven to be an accurate, high-speed solution for performing the many iterative measurements necessary for EVM characterization. The characterization curves shown in Fig. 1 are the result of calculations made at 12 power level steps, iteratively performed at each of 10 frequency steps. The resulting measurement time was only 4.3 s, or 10 times faster than the solution it replaced.
In this example, 8,192 IQ sample pairs were captured at each power level step. EVM and amplifier output power were calculated for each captured sample set. This capture/calculation process was repeated 120 times on a total of 983,040 captured sample pairs.
The number of IQ sample pairs needed to make accurate measurement calculations is a limiting factor for test time. Another is the hardware response times of the test equipment. Greatest efficiency / test time optimization is achieved when capturing the least number of required samples using the fastest responding test equipment.
Sample rate optimization is achieved by determining an appropriate sample rate and overall sampling interval for each type of communications signal. In the case of bursted signals, capture of only one burst is required for an Aeroflex measurement algorithm to make the needed calculations. Hardware response times are technology and manufacturer specific.

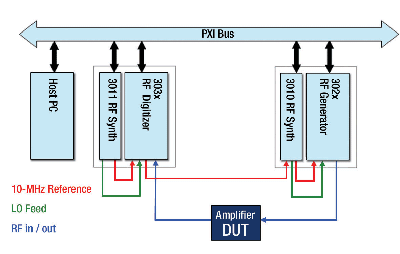
Fig. 2. The amplifier test configuration shown uses PXI as the control bus.
The system used to perform these tests consisted of an Aeroflex PXI system containing an RF Signal Generator (3010/302x modules), RF Digitizer (3011/303x modules), and embedded host PC (see Fig. 2 ). A specially developed software application uses the PXI functionality to iteratively step through the power and frequency levels and measure and plot EVM versus output power for various standards, including WiMAX and WLAN. Measurements can be made quickly over a range of power level and frequency steps, saving time and allowing the user to produce results without difficulty.
An EVM characterization application
The EVM characterization results shown in Fig. 1 are achieved using a software application that controls the instruments and calculates EVM and amplifier output power.
The process begins with the PXI RF signal generator playing an ARB file containing the appropriate signal attributes needed to exercise the amplifier under test with respect to the type of communication standard being characterized. The modulated RF signal is applied to the amplifier input.
The signal generator’s output power level is automatically stepped through a range of power levels set by the user. These power-level steps are repeated over a number of carrier frequency steps.
The RF digitizer automatically tracks the signal generator’s power level and carrier frequency and captures the selected number of I/Q samples from the amplifier output. The captured I/Q sample arrays are transferred to the host PC, where EVM and output power levels are calculated by the software application, using functionality from the appropriate measurement suites.
The user determines the initial power level, step size, and number of steps. The application contains a manual operation mode that lets the user experiment with power, frequency, attenuation, and other programmed settings. By experimenting with individual test settings, the user can verify the test hardware configuration and establish acceptable programmed settings.
Once the initial test settings are established using the manual mode, the settings are transferred to the application’s automatic mode, allowing for multiple EVM and power measurements to be made. The auto mode allows the user to experiment with EVM/power measurements at any number of carrier frequency increments. The calculated EVM/output power measurements at each frequency can be written to a file. A resulting graphical plot, like the one shown in Fig. 1, can be written to a .png file.
The ARB file played by the signal generator is formatted to provide a signal for the type of communications standard being measured against. For example, to measure WiMAX 802.16e uplink EVM characteristics, an ARB signal with the particular attributes of link direction, bandwidth, guard period, modulation type, and so forth can, in this example, be created using the Aeroflex IQCreator software tool. The files created with this tool can be saved in a library as well as loaded into the signal generator ARB’s memory.
Since extensive data capture and computation must be done iteratively over ranges of many power levels and frequencies, making the data capture and computation process very time efficient is essential. A PXI system can perform this process much faster than traditional rack-and-stack instrumentation: test times of seconds or tens of seconds have been compared against methods taking many minutes. ■
Advertisement
Learn more about Aeroflex


