Seeing the spectrum without gaps reveals behavior over time
The result of spectrum processing without gaps is a spectrum display that reveals all spectral variations within the capture bandwidth. The real-time processing of the incoming DFT frames provides spectrum updates that can surpass 292,000/s, far in excess of the rate that current technology can update the display. This requires compression to provide visibility of a single spectral event at a rate compatible with the display. This compression is done as a bitmap display, with each pixel accumulating histogram data as the spectra are generated.
Using a traditional vector signal analyzer, only the envelope of the signal energy of a complex radar pulse spectrum would typically be seen. Using a max-hold display would potentially, over time, give the user a general indication of spectral activity occurring in this span.
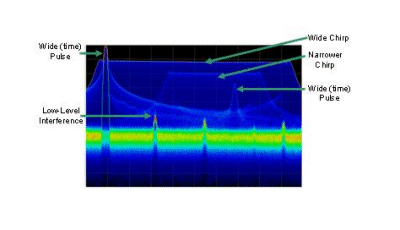
In contrast, a real-time spectrum analyzer that uses overlapped DFT processes and a histogram-derived display can show everything in the spectrum. This type of processing allows the signal analyst to see signals on top of other signals. (see Fig.)

Use of real-time DFT and a display histogram, makes multiple signals clearly visible.
Note the very wide linear FM chirp that occupies most of the display in dark blue. There is another linear FM chirp just to the center of the display that is a few dB below the wider signal. Near the top left of the display is a narrow-frequency (but wide-in-time) pulse that is superimposed on the wide chirp. The red in the display represents the portions of the spectrum that are nearly continuous due to high hit numbers. There is another narrow-bandwidth signal beneath the two linear chirps.
The low-level interferers occur much more frequently than any of the other signals, causing the displayed color intensity to move from green to yellow to red as the number of hits at those pixels increases. ■
Advertisement
Learn more about Tektronix


