The latest class of simulators support some unique features
BY DARREL JOHANSEN
Microchip Technology
Chandler, AZ
http://www.microchip.com
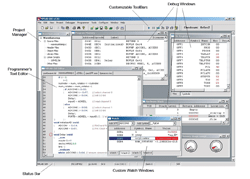
There are many ways to debug an embedded application. A debug tool, comprising in-circuit emulators (ICEs) and in-circuit debuggers (ICDs), enables the designer to prototype a system quickly, and helps identify hardware and software problems—both in the prototype and final-test stages. During the debug process, where cost and ease of use are major issues, designers may prefer to use a simulator instead of an ICE to debug code fragments—because it can be done on a PC without the need for target hardware. Simulators can be very handy because developers can use them to learn about a new MCU or familiarize themselves with a new integrated development environment (IDE) tool suite without the target hardware. In some cases, they can review all of a vendor’s MCUs for free. For example, both the MPLAB IDE and MPLAB SIM simulator (see Fig. 1 ) from Microchip can be downloaded free from the vendor’s Web site.

Fig. 1. Many simulators, such as Microchip’s MPLAB SIM, provide a graphical user interface to aid fast application debug.
Simulator offers extra debug features
Generally, a simulator runs under an IDE and has similar features to other debug engines. You can start by developing code using the simulator and, when your hardware is ready, you can use a hardware debugger to do testing The basic debug functions that can be performed by the simulator include: executing the code to verify it functions to specifications; resetting the target to restart the application; halting the program at breakpoints; and examining and modifying memory and variables.
You can do more with the latest class of simulators, which support some unique features not available with hardware debuggers. For example, you can easily break execution on complex situations—a feature that is not supported by all ICEs and ICDs. Complex events can even be constructed to count occurrences and execute a breakpoint. This kind of complex breakpoint allows you to describe the condition where your code misbehaves, and traces code at that condition. This is usually a much faster way of finding bugs than setting simple breakpoints and stepping through your code.
Analyze code through simulation
Designers can use a simulator to react to pin inputs and outputs, as well as mimic the peripherals found on an MCU. To facilitate this, advanced simulators feature a complex stimulus generator that simulates signals. Using this feature you can test a firmware module by providing inputs to it in ways that are difficult to produce using the real hardware—for example, creating two interrupts 50 ns apart. The stimulus generator can send signals to pins or to registers in the simulator. The activity of the simulator can be sent to a log file for later analysis by using a USART as an I/O device or by using a register log.
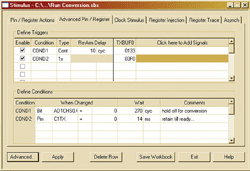
Three types of stimulus sources are supported by most simulators. Manual triggers can be activated with mouse clicks, cyclic stimulus generates a repeating waveform, and sequential stimulus that applies data to pins, registers, or bits in registers from a list. This sequential data can be entered in a dialog box, or it can come from a file. Peripherals can also be simulated so that devices such as A/D converter, I/O pins, serial communications peripherals, and timers can be active. The peripherals can use inputs from simulated waveforms and simulated digital signals, and can accept manual inputs to simulate interrupts and sensor readings (see Fig. 2).

Fig. 2. Simulators often support three types of stimulus sources and feature easy definition and setup.
Improve code performance
Most advanced simulators allow you to correlate the execution of the application on the target with the source code, enabling you to single-step through high-level language code, such as C source code, even though each C statement may generate many lines of machine code. Likewise, memory storage in file registers is correlated with the variables you use in your program. So, if you have a floating-point number that spans multiple machine file registers, you can monitor the register contents in a watch point to display the value in a floating-point representation.
Routines can be optimized, and critical code timing can be accurately measured and adjusted with the help of a simulator. You can time a section of code using a simulator’s stopwatch feature. Based on the processor frequency, the stopwatch calculations are made on the instructions executed.
The stopwatch is not the only way to measure time in a simulator. Some applications, such as motor control, may not allow for halting at a breakpoint. In these cases, capturing the program flow and register reads and writes in the trace buffer may be a good alternative. The trace buffer records instructions when they execute, and puts a time stamp on each instruction. In this way, after you capture events in the trace buffer you can time them. For instance, you can capture a series of interrupts, and then easily calculate the time between interrupts and the total time each interrupt took to execute.
The simulator can log register changes to files for performance analysis. Using a simulator, you can test or stress an algorithm by observing how it responds to multiple inputs. For instance, you can run a fast Fourier transform (FFT) on multiple sets of canned data (such as data obtained by reading the A/D converter result registers using target hardware), but with total control as to the kind of data you would expect to see. ■
Advertisement


