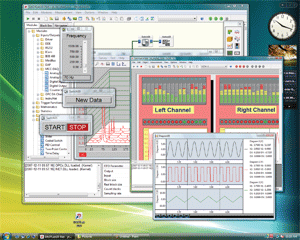
Software has graphical programming capability
DASYLab 10 software comes with a new graphical display module, named Diagram, which may be configured as an enhanced y/t, x/y, or data chart recorder. It supports multiple y-axes and lets the user assign signals to each y-axis. For comparison of the time domain waveforms, users can define the signal offset and dynamically move a signal around within the graphical display.

A benchmarking feature measures and records execution times of individual test-program modules so users can optimize performance. The Microsoft Vista-compatible software is offered in five versions: Lite, Basic, Full, Pro, and runtime-only. (From $449 — available now.)
Measurement Computing , Norton , MA
Dan Mandill 508-946-5100, ext. 219
Advertisement
Learn more about Measurement Computing


