BY MARTIN ROWE, Senior Technical Editor, Test & Measurement
EDN and EE Times
www.edn.com , www.eetimes.com
When you think of “the cloud” and “big-data analytics,” you probably think of a nebulous place where marketers store data about everyone’s whereabouts and buying preferences. But wait, engineers don’t do analytics; they do analysis. Nevertheless, having test data stored and processed in the cloud can offer some advantages over storing it locally.
Several companies have developed web-based apps for using the cloud to store test data, analyze that data, and even control bench instruments. So far, each application we’ve seen serves a different purpose.
Why store test data in the cloud? There are several reasons, but they come with tradeoffs. Advantages include:
- Dynamically change computing power and storage capacity. You don’t have to go through the process of getting more power and storage from your IT department.
- Share test data with colleagues, suppliers, and customers anywhere in the world. Think of it as a Google spreadsheet for test data but with far more analysis power.
- Monitor product test status from your desk or while traveling. You don’t have to wait for someone across an ocean to send test data.
- Analyze large amounts of data and look for correlations between measurement data and metadata (test conditions) on the server, keeping your computer, tablet, or phone free from any data processing.
On the downside, data is likely more secure if stored on your company’s internal network. That’s a choice you’ll have to make when deciding to use a third-party cloud service or store and process data on internal servers.
San Francisco-based company GradientOne has developed a cloud-based app that lets you automate test benches in the lab or on the manufacturing floor. It’s the only app we’ve seen that can control hardware directly. Using a hardware gateway between the internet and your test equipment, GradientOne’s app uses “drivers” designed to control oscilloscopes, meters, and spectrum analyzers. You can automate tests using an application programming interface (API) or from a soft-front panel.
GradientOne’s web-based app lets you move test data directly from test instruments to the cloud. Alternatively, you can collect data offline and then upload to GradientOne’s cloud-based app for data storage and analysis. Because test data can come directly from your test equipment, you can not only generate reports, but you can see specific test results, including waveforms (Fig. 1 ).
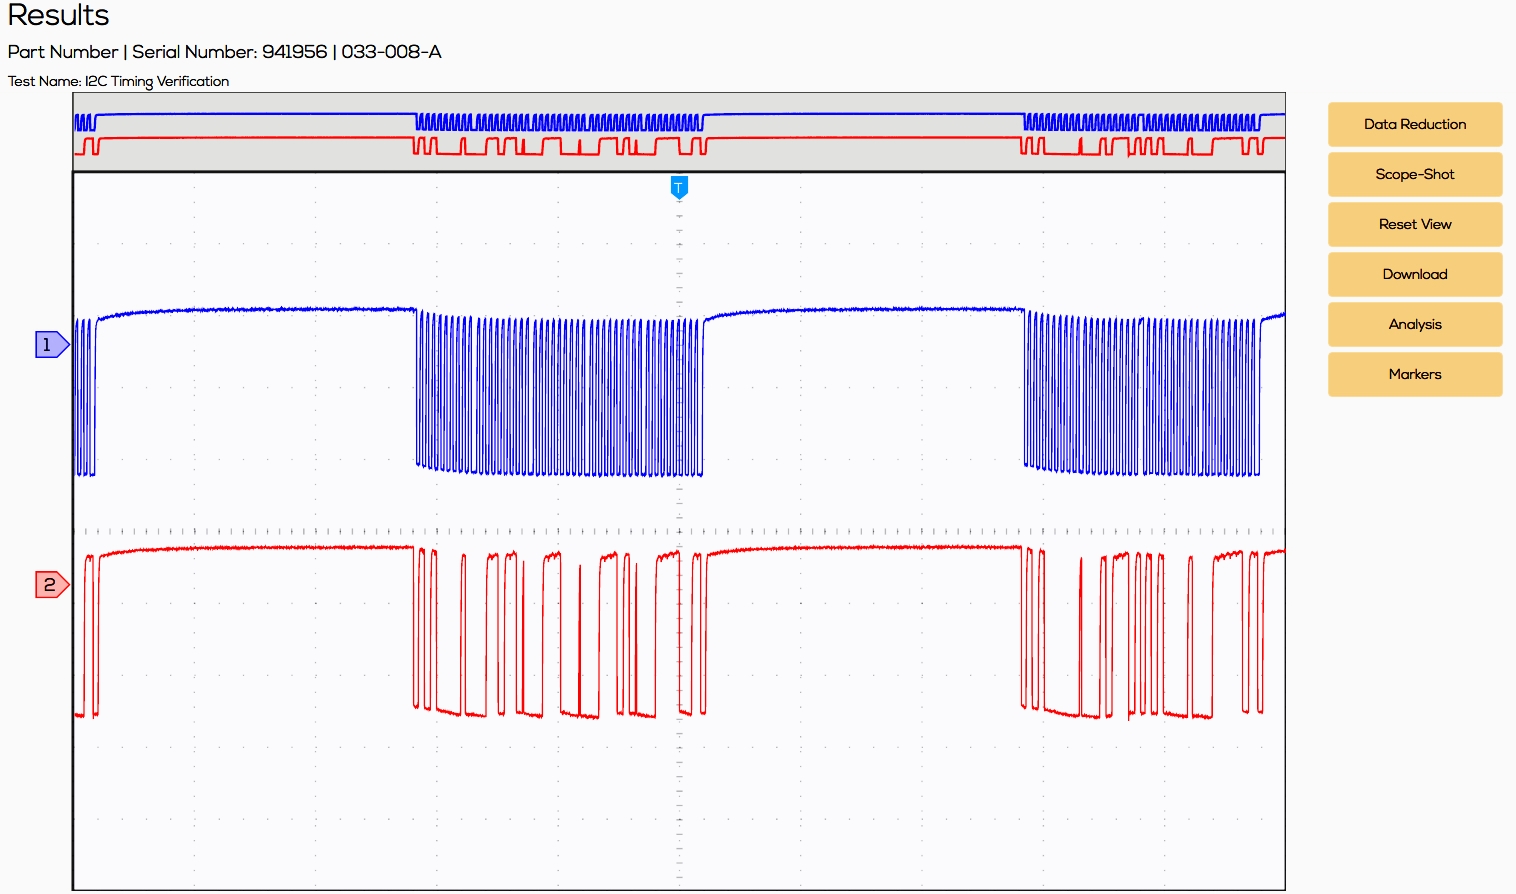
Fig. 1: A cloud-based app from GradientOne lets you control test instruments such as oscilloscopes, display waveforms, and process measurement data. Source: GradientOne.
JitterLabs, based in Milpitas, California, has developed software designed to help you select clock oscillators for high-speed serial interfaces. The problem stems from the fact that serial-data specifications have differing requirements for bit jitter. Plus, there’s no established test method for measuring jitter and noise in clock sources.
JitterLabs has developed a measurement method that the company offers as a service. A cloud-based app takes data from measurements taken at JitterLabs and stores the data on two servers — one stores the data and the other performs the data processing. The servers, owned by JitterLabs, are hosted by a third party. Jitterlabs’ Gary Giust notes that the server used to store the data uses hardened security. The database stores measurements and metadata about each measurement. For example, data might include the manufacturer’s name and part number for each reference clock, the oscilloscope used to measure jitter, and specifications from clock manufacturers such as phase noise. Once the clock signals are stored, you can process the data using filters and compare the results against published standards. The graphic in Fig. 2 shows where data comes from and what the cloud-based app produces.
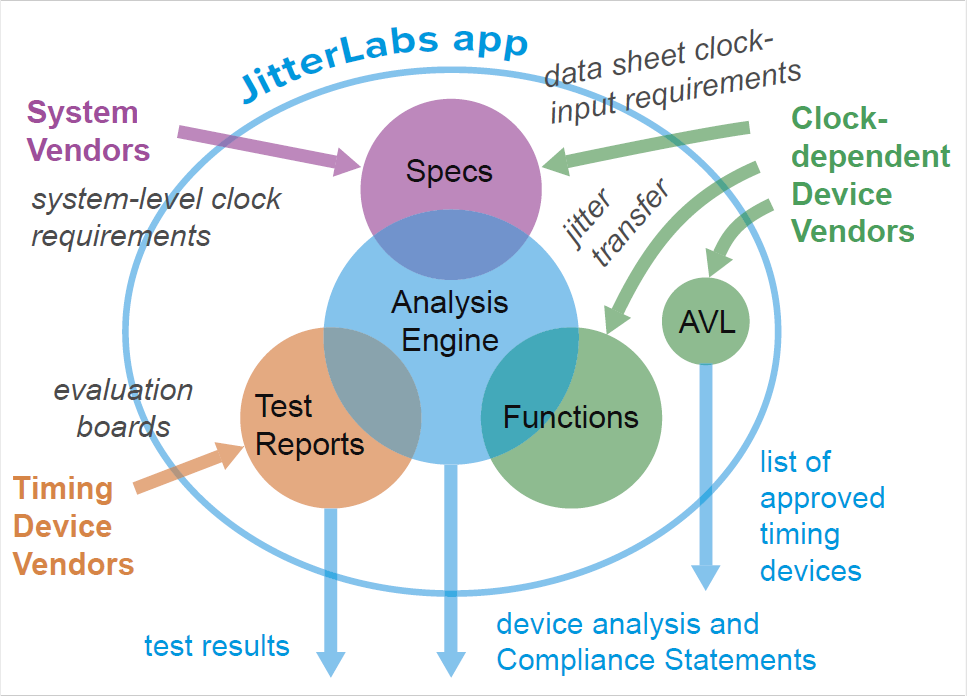
Fig. 2: JitterLabs uses a cloud-based service to filter data from clock sources, from which you can choose a clock for high-speed designs. Source: JitterLabs.
Keysight Technologies has introduced its N8844A cloud-based software visualization tool. It helps engineers and managers review test results and make decisions based on those results. Keysight’s R&D Manager, Brad Doerr, explained how engineers use the N8844A’s data-analysis tools to track projects and analyze data by using the cloud’s processing power. You can plot data based on measurements versus a specific parameter, such as bit errors versus input voltage or output power versus temperature. Fig. 3 shows a histogram of bit errors.
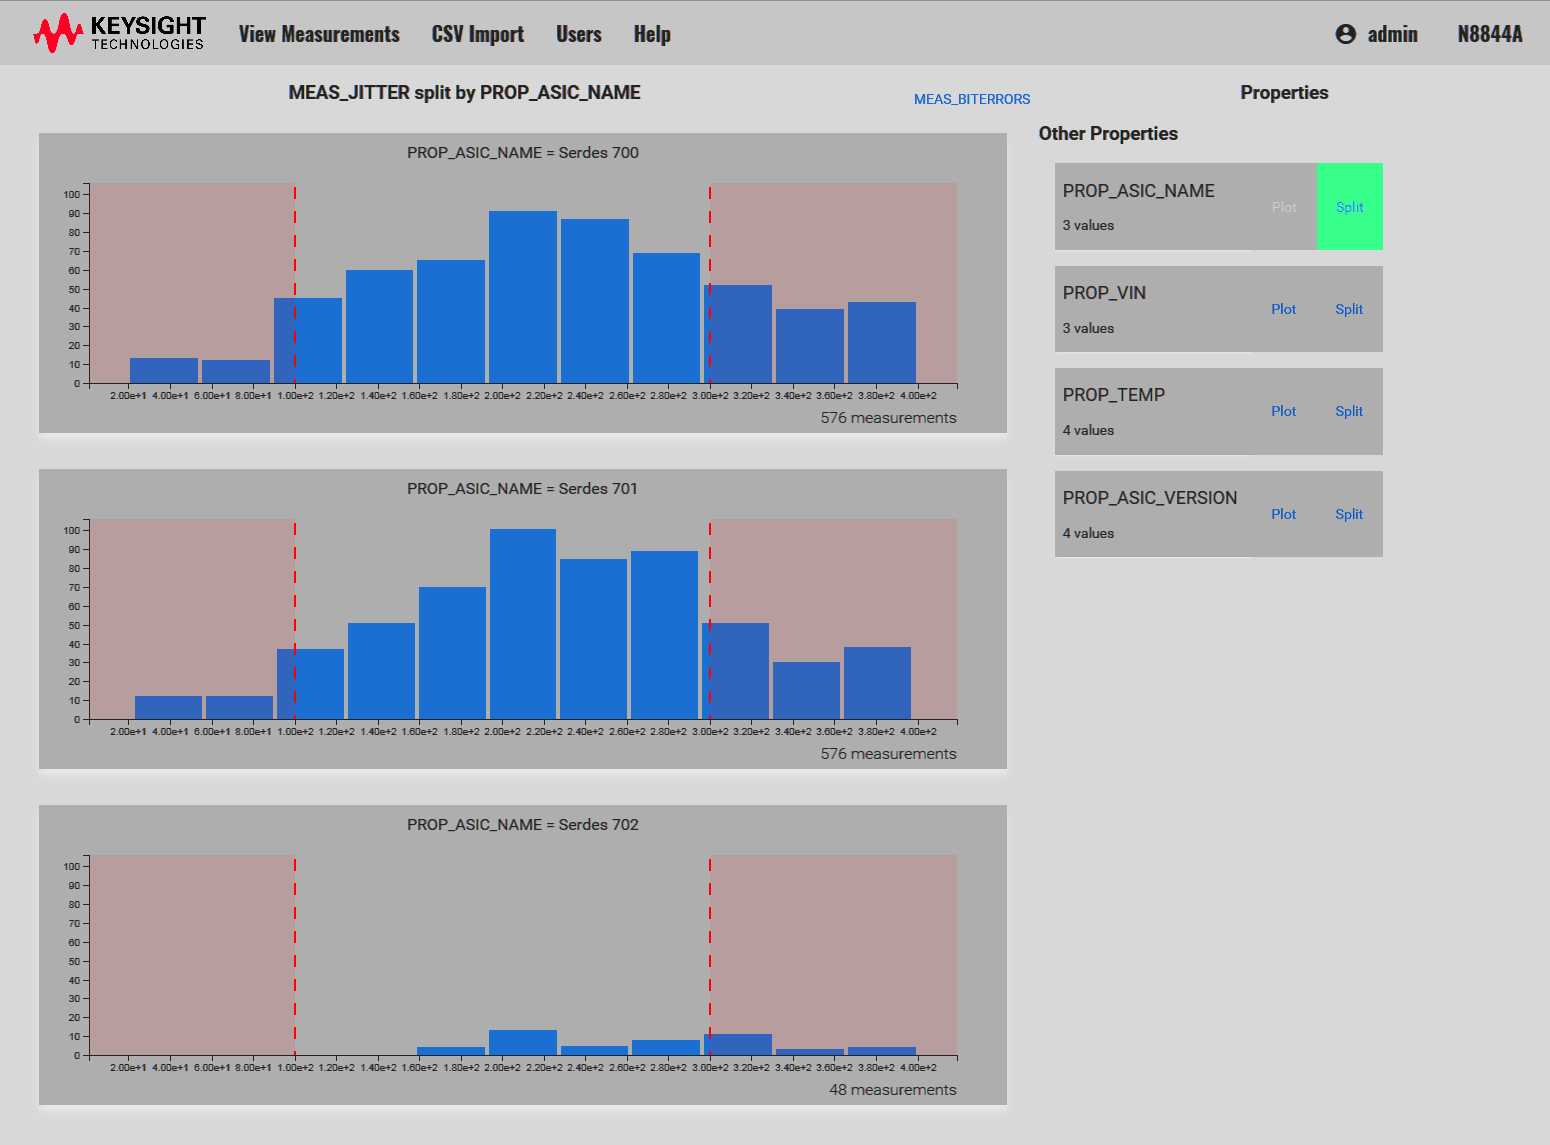
Fig. 3: The N8844A from Keysight Technologies lets you process and share test data with colleagues. Source: Keysight Technologies.
Semiconductor manufacturing generates tons of data. With engineering and manufacturing often separated by oceans, having a way to easily share data and analyze test results can shorten problem-solving times. Optimal+ software for manufacturing lets you store data in the cloud, share it, and analyze it. Fig. 4 shows how you can use scatter plots to identify potential recall parts before they reach customers.
Optimal+’s Director of Marketing, David Park, explained that when returned parts exhibited certain characteristics in final tests, a manufacturer looked through test data and found other parts that differed from the norm. Once the correlation was made between this particular test result and returned parts, engineers created a rule that flags parts whenever these conditions occur, thus preventing potential questionable parts from being shipped.
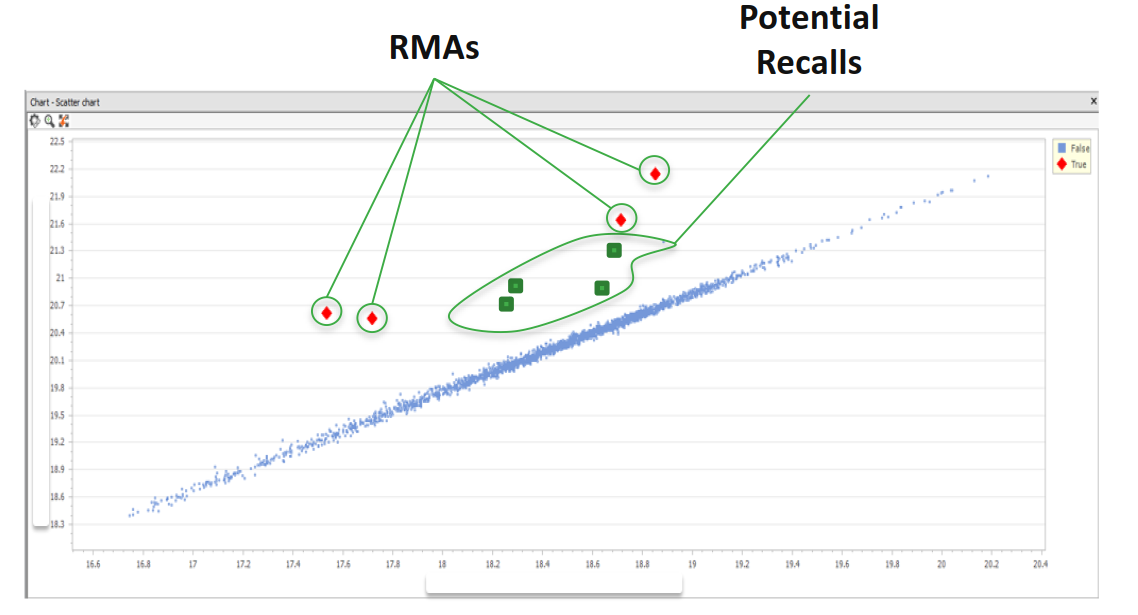
Fig. 4: Software from Optimal+ runs in the cloud or on local networks, collecting semiconductor manufacturing data for analysis. Source: Optimal+.
Another cloud-based app for semiconductor manufacturing comes from MFG Vision, which is based in Limerick, Ireland. MFG Vision’s software is aimed at fabless semiconductor companies who use third-party foundries and test houses. The company has developed a series of cloud-based apps that let you monitor manufacturing and test activity in real time.
The company provides scripts that also let you upload data from your company’s operations or from third parties. Because MFG Vision provides these scripts, the company guarantees that test data will be uploaded to the cloud, said company founder, John O’Donnell. Data storage and processing can be hosted on a third-party cloud service or on a company’s internal network.
Once data is uploaded, metadata is extracted from the raw data. The server processes data, letting you add filtering and correlation that looks for conditions that might lead to failures. Test data can be from assembled ICs or from on-wafer devices. Fig. 5 shows yield data for a lot of 77 wafers. Colors indicate the yield percentage for each die location.
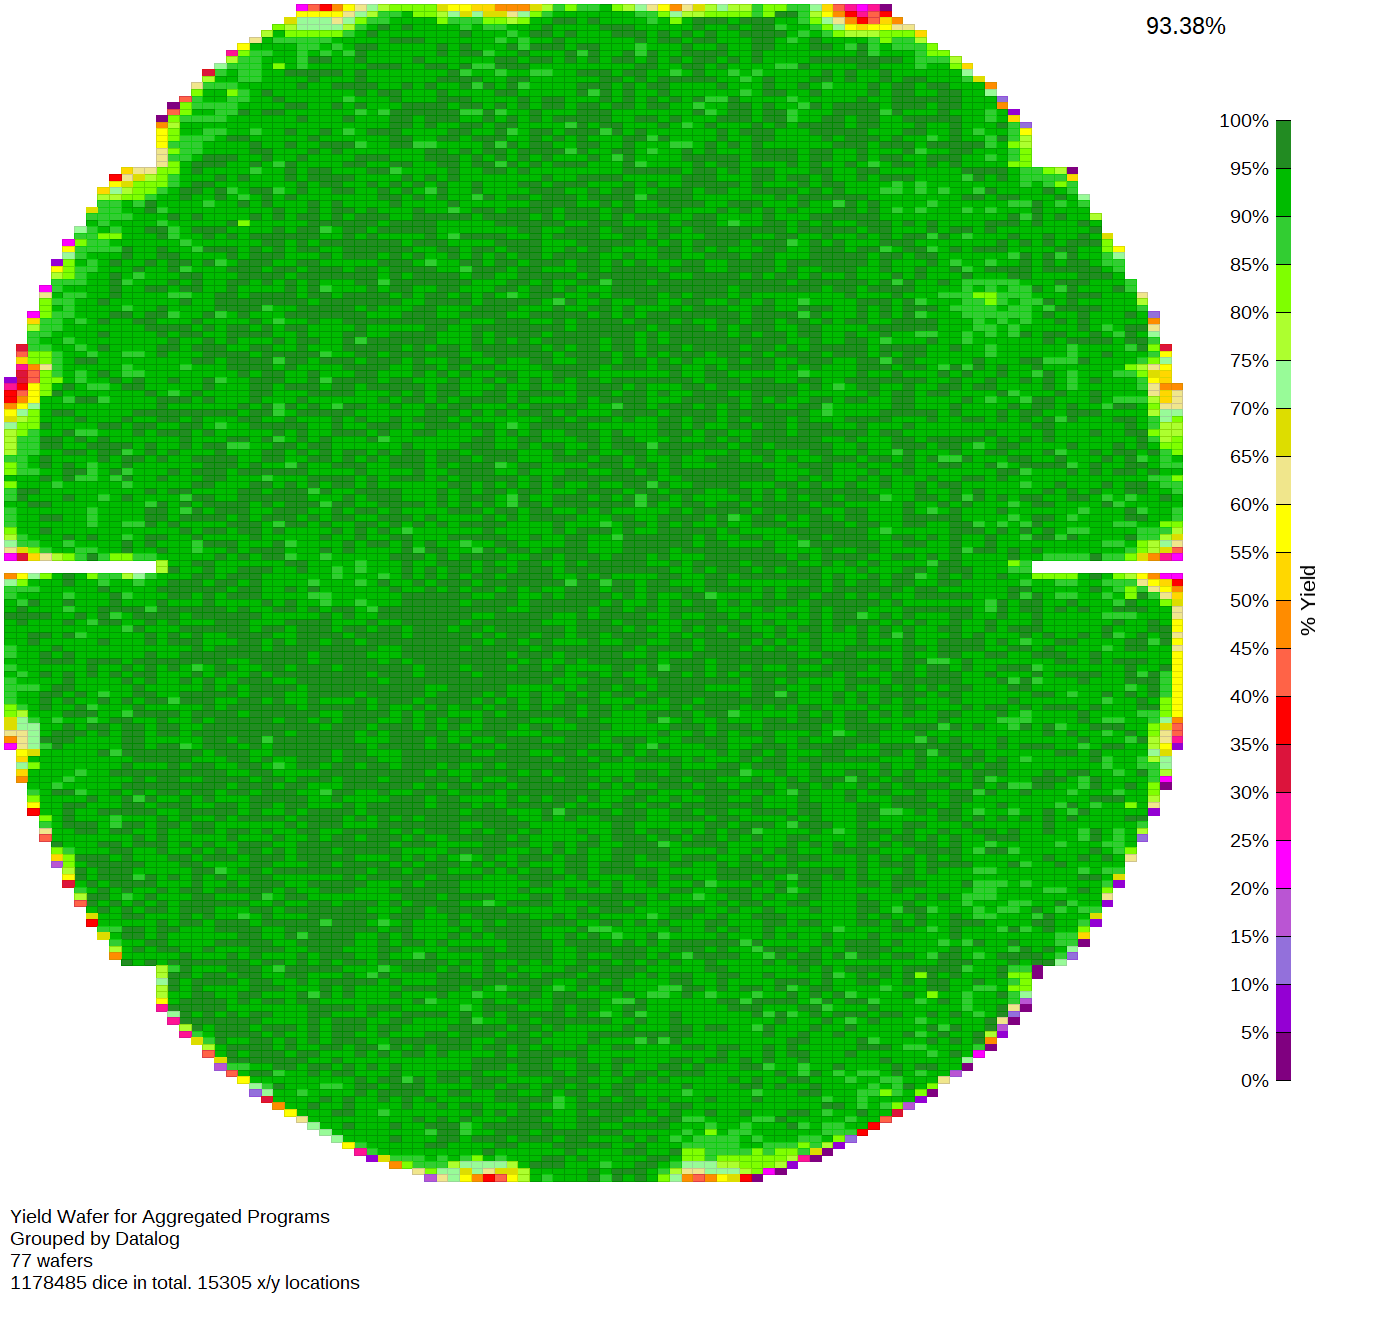
Fig. 5: One of several cloud-based apps from MFG Vision produces a yield map from a set of wafer tests. Source: MFG Vision.
In addition to providing data analysis, MFG Vision’s apps let you collaborate with colleagues so that anyone with login privileges can share data and plots. Plus, anyone can perform analyses on the data because it resides in the cloud.
Conclusion
Regardless of how you use cloud-based (or any other) measurement and analysis software, your results are only as good as your measurements and the data you collect. Keysight’s Doerr noted that metadata should include not only physical conditions placed on the device under test (DUT) — power-supply voltage, temperature, etc. — but it should include information such as process variables, who ran the tests, and with which equipment. You may find that experienced engineers get better test results. If one test setup produces data different from others, then something may be out of calibration. The software or firmware installed in your DUT can make a difference, so track that, too.
All of the products covered here can process data and can let you correlate test results with test conditions. Look at them carefully and evaluate them against your needs.
Advertisement


