The temperature coefficient of resistance (TCR), also referred to as RTC, is a performance characteristic that is heavily influenced by resistor construction for very low resistance values and can be obscured by different specification methods. In this article, we will highlight the construction features and specifications that contribute to TCR and how to better understand this resistor performance parameter. This parameter is important because it contributes to the stability of the current measurement, which affects how you account for change in temperature and how you choose a component to meet your precision and accuracy requirements.
Cause and effect 1
Resistance is a result of a combination of factors that cause an electron’s movement to deviate from an ideal path within a crystalline lattice of a metal or metal alloy. As an electron encounters defects or imperfections within the lattice, it can cause diffusion. This increases the path traveled, resulting in an increased resistance. These defects and imperfection can result from:
- Movement in the lattice due to thermal energy
- Different atoms present in the lattice, such as impurities
- Partial or complete absence of a lattice (amorphous structure)
- Disordered zones at the grain boundaries
- Crystalline and interstitial defects in the lattice
TCR, measured in ppm/°C, is a characteristic of the thermal energy component of the above imperfections and varies widely among different materials (see Table 3). It measures the change in resistance value over a temperature range. The effect of this resistance change is reversible as temperature returns to reference temperature.
An alternative visualization for the TCR effect is the rate of expansion of a material with temperature. Consider two different bars, A and B, that are each 100 meters in length. Bar A changes length at a rate of 500 ppm/°C and Bar B changes at a rate of 20 ppm/°C. A temperature change of 145°C will cause the length of Bar A to increase by 7.25 meters, whereas Bar B will increase by only 0.29 meters.

Fig. 1: The graphic scale (1/20) visually presents the TCR difference with temperature. Bar A has a noticeable change in length, whereas Bar B has no visible difference. (Source: Vishay Intertechnology)
This applies to resistors, as lower TCR results in a more stable measurement across temperature caused by applied power (causing the resistance element temperature to increase) or ambient environment.
How TCR is measured
TCR performance per MIL-STD-202 Method 304 is resistance change based on a reference temperature of 25°C. The temperature is changed, and once the resistor reaches equilibrium, the difference in resistance values is TCR. An increase in resistance for an increase in temperature is positive TCR (note, self-heating also causes a resistance change due to TCR), and a decrease in resistance for an increase in temperature is negative TCR.
Resistance — temperature coefficient (%):
Resistance — temperature coefficient (ppm):![]()
R1 = Resistance at reference temperature
R2 = Resistance at operating temperature
t1 = Reference temperature (25°C)
t2 = Operating temperature
Operating temperature (t2) is often based on the application. For example, instrumentation typically ranges from –10°C to 60°C, while operating temperatures for military applications are typically –55°C to 125°C.
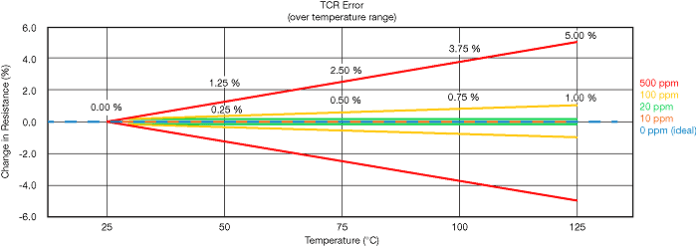
Fig. 2: A comparison of different TCR levels as resistance change percentage versus increasing temperature from 25°C. (Source: Vishay Intertechnology)
The following equation calculates the maximum change in resistance value for a given TCR.
R = final resistance
R0 = initial resistance
α = TCR
T = final temperature
T0 = initial temperature
How construction and materials affects TCR
Metal Strip and Metal Plate technologies offer superior TCR performance when compared with traditional thick-film current-sense resistors because the thick-film resistive material is mostly silver, with terminals of silver and copper offering relatively high TCR performance values.
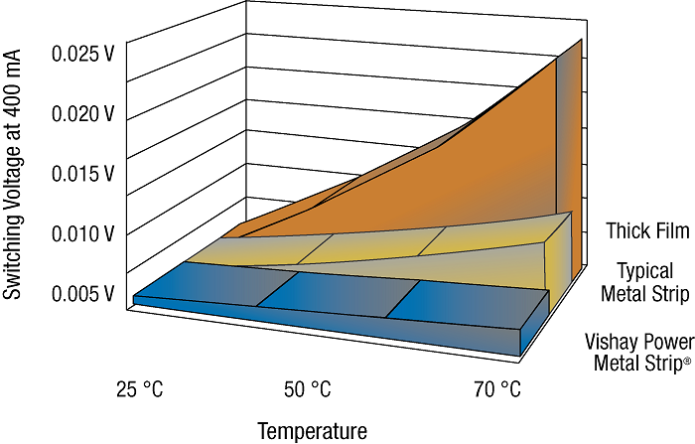
Fig. 3: Temperature coefficient of resistance performance comparison (Source: Vishay Intertechnology)
Metal Strip resistor technologies use a solid copper terminal (Fig. 4, Item 2) that is welded to a low TCR resistance alloy (Fig. 4, Item 1), achieving values down to 0.1 mΩ and low TCR. However, the copper terminal has a high TCR (3,900 ppm/°C) compared with the resistance alloy (<20 ppm/°C) that contributes a greater portion to the overall TCR performance at lower resistance values.
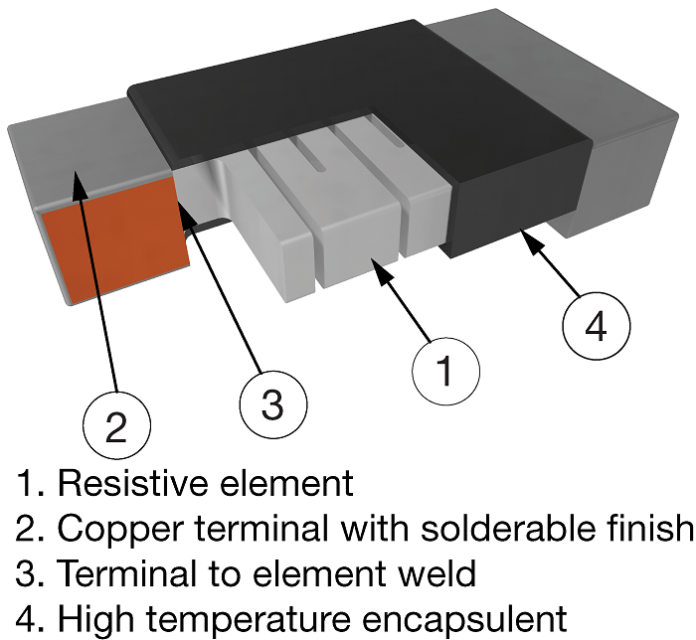
Fig. 4: Metal Strip current-sensing resistor (Source: Vishay Intertechnology)
The copper terminal provides a low resistance connection to the resistance alloy that enables a uniform distribution of current flow to the resistance element for a more accurate current measurement. The following graphic (Fig. 5) displays how total resistance is influenced by the combination of the copper terminal and low TCR resistance alloy. For the lowest resistance values of the same construction, the copper becomes more significant in the TCR performance.
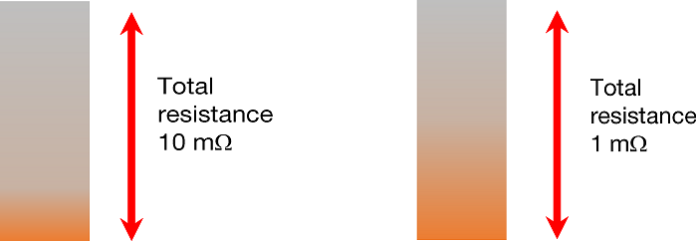
Fig. 5: Copper terminal and resistance alloy contribute to the total resistance. (Source: Vishay Intertechnology)
Kelvin terminal vs. two-terminal
The Kelvin (four-terminal) construction provides two benefits: improved current measurement repeatability and TCR performance. The notched construction reduces the amount of in-circuit copper from the measurement.
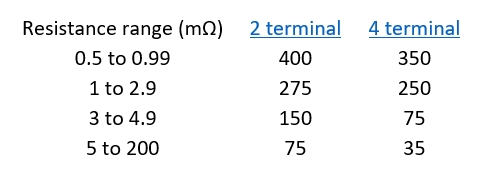
Fig. 6: A comparison of a Kelvin termination with a two-terminal 2515 (Source: Vishay Intertechnology)
There are two key questions:
- Why not notch all the way to the resistance alloy for the best TCR?
The copper allows for a low resistivity connection to measure current flow. Notching to the resistance alloy causes the measurement to be applied through a portion of the resistance alloy where there is no current flow, resulting in increased measured voltage. The notch is a compromise between copper TCR effects and measurement accuracy and repeatability.

Fig. 7: Notched construction (Source: Vishay Intertechnology)
- Can I use a four-terminal pad design to obtain the same results?
No. While the four-terminal pad design does offer better measurement repeatability, it does not remove the effects of copper from the measurement circuit and would still have the same rated TCR.
Clad construction vs. welded
Terminals may be constructed of a thin copper layer to the resistive element that will affect the TCR rating and measurement repeatability. The thin copper layer is achieved by a clad construction or by electroplating. Clad construction uses extreme pressure to mechanically bond a copper sheet to the resistance alloy to create a uniform interface between the materials. In both construction methods, the copper layer thickness is typically a few thousandths of an inch, which minimizes the effect of copper and provides an improved TCR.
The tradeoff is that the resistor will shift slightly in value when mounted to the board because the thin copper layer does not permit a uniform distribution of current through the high-resistance alloy. In some cases, the board-mounted resistance shift can be much greater than the effects from TCR between the resistor types being compared.
Not all datasheets are created equal
Some manufacturers will list the element TCR, which is only part of the overall performance, as the termination effects are ignored. The key parameter is component TCR that includes the termination effects, which is how the resistor will perform in the application.
In other cases, the TCR characteristic will be for a limited temperature range, e.g., 20°C to 60°C, while another may present across a wider range, e.g., –55°C to 155°C. When these resistors are compared, the resistor specified for a limited temperature range will present better performance than the resistor specified over a wider range. TCR performance is typically non-linear and is worse in the negative temperature range.

Fig. 8: TCR for the same WSLP2512 resistor across different temperature ranges. Click for larger image. (Source: Vishay Intertechnology)
If a datasheet lists TCR for a range of resistance values, then the lowest resistance value of the range sets the limit due to the termination effects. A higher-value resistor in the same range likely has a TCR closer to zero because more of the total resistance is derived from the low-TCR alloy.
One other point to clarify (see Fig. 8) is that resistors do not always have this magnitude of slope, as some may be flatter; this is dependent upon the interaction of TCR for both materials for the resistance value.
In summary, there are many factors that influence TCR, and datasheets may not present the information that you need or with the detail that you require. As a designer, if you need additional information to support your decision, then you should contact technical resources of the device supplier.
Resources:
- 1Citation for highlight: Zandman, Simon, & Szwarc Resistor Theory and Technology, 2002, p. 23–24
- Calculator: Change of Resistance Due to TCR Calculator
- White Paper: Power Temperature Coefficient of Resistance (contains checklist for comparing datasheets)
- Overview: Power Metal Strip Surface-Mount Current Sensing Resistors
Advertisement
Learn more about Vishay Intertechnology


