Employing this approach lets any desktop test system or ATE to quickly test and verify these widely used transceivers
BY DAVE MACEMON
Marketing Manager, Silicon Test Solutions
Mentor Graphics
www.mentor.com
Serializer/deserializer (SerDes) transceivers are implemented in ICs today to support the latest high-speed serial interface standards. Mainstream data rates for SerDes range from 2.5 to over 10 Gbits/s.
Performing characterization and manufacturing test on these transceivers typically requires expensive automatic test equipment (ATE) and a lot of time. However, using embedded test for SerDes enables any desktop test system or ATE to quickly test and verify these transceivers.
SerDes transceiver tests
The standard test for SerDes transceivers is a bit-error rate (BER) test. The BER measurement is the number of bit errors detected divided by the total number of bits transmitted/received. Bit errors are most commonly caused by timing jitter, that is, unexpected variation in data edge-to-edge times.
Most protocol standards require a BER of 10−12 and some are specifying a BER of 10−14 . For a bit error rate of 10−12 , there can only be one bit error per 1012 bits. At a 1.25-Gbit/s rate, it would take 800 seconds (>13 minutes) to transmit/receive 1012 bits. This is much too long for a production test.
Because BER is primarily determined by the amount of high-frequency (HF) jitter in the signal edges, BER can be predicted by accurately measuring the random and deterministic portions of this jitter. BER can be calculated using precise jitter measurements performed by embedded tests in hundreds of milliseconds instead of minutes or hours. Embedded tests also can measure wave shapes and various jitter tolerance parameters. All of these measurements are performed inside the IC, after the receiver’s equalizer [1] .
Electronic design automation (EDA) software generates digital IP that is inserted into the design at the RTL level, which uses standard digital library cells to perform structural tests and an IEEE 1149.1 test interface for test control. Most importantly, no changes to the SerDes IP are required.
To be tested using EDA software, SerDes IP must meet the following requirements:
The receiver and transmitter frequency can differ (20 to 200 ppm).Encoding and decoding hardware can be bypassed in test mode.High-frequency jitter in the receiver is similar no matter if the receiver is locked to its reference clock or to the serial data (recovered clock).
Basic SerDes operation
Before looking at jitter measurements, let’s look at how a SerDes transceiver works in normal operation, using a simplified block diagram of a SerDes (Fig. 1 ).

Fig. 1: This simplified block diagram of a SerDes shows Tessent SerdesTest connections for jitter testing.
For a serial transmission rate of 1 Gbit/s, the serial transmission clock, fTX , wi11 have a frequency of 1 GHz (1 ns period). If the parallel bus delivering data to the transceiver is 10 bits wide (N = 10), then the parallel bus speed will be fTX /10, or 100 MHz. The serial receiver clock, fRX , will likewise be 1 GHz, and the parallel bus speed at the output, fRX /10, will be 100 MHz.
After establishing synchronized communication, the receiver recovers the receiver clock (fRX ) from the data edges and clocks the data into the deserializer at 1 Gbit/s. When 10 bits have been recovered, the deserializer clocks out the 10-bit parallel data.

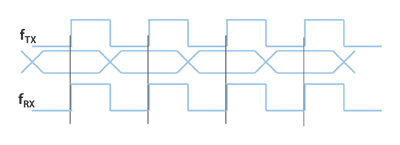
Fig, 2: Representative wave form for normal communication.
In normal operation, the receive clock is recovered by the CDR (clock and data recovery), and is synchronous to the transmit clock.
Measuring jitter
The SerDes test software uses under-sampling to obtain the data required for jitter measurements.
To perform undersampling, the receiver clock (fRX ) is set to a frequency that is slightly lower than the transmitted data. To achieve this, the clock recovery is disabled and the parallel-rate under-sampling clock frequency (fRX /10) is set to be slower than the transmit clock frequency.
This example will set the receive clock, fRX , to be 0.01% slower than the transmit clock. An external source is used, and a clock period of 10.001 ns is generated. This period will be 1 ps longer than the 100-MHz parallel clock period used to transmit data.
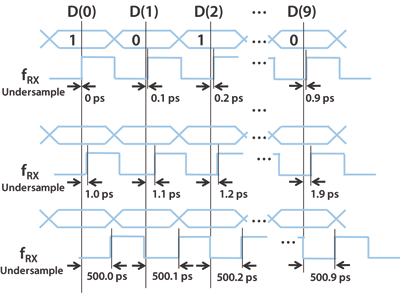
To measure jitter for this example, a 10-bit repeating pattern, 1010101010, is set up for the parallel data input. It is serialized and transmitted at 1 Gbit/s (1 ns period). The receive clock (fRX ) is set up to under-sample with a frequency of 999.9 MHz (1.0001 ns, or a 0.1 ps offset). The fRX will thus be offset by +0.1 ps with each incoming data bit (Fig. 2 ). At the second 10-bit transfer, fRX will continue to be offset at +1 ps per cycle of 100 MHz.

Fig. 2. Offset/undersample for 1st, 2nd, and 500th cycle.
So it stands to reason that at the 500th 10-bit transfer, fRX will start sampling the data contained in the transmitted D(1), and this data will be loaded into the D(0) of the deserializer’s received 10-bit parallel data. Through this scheme, jitter measurements can occur through all of the 10-bit serial data stream.
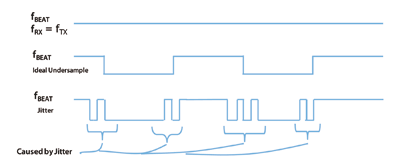
The SerDes test software performs its analysis by tapping into 1 bit of the deserializer. For this example, the measurement tap is attached to bit D(0) of the 10-bit received data. The frequency of the measured waveform is referred to as fBEAT . By “walking” fRX through the eye of the data, the under-sampling technique will detect jitter as unexpected transitions occurring around each ideal edge position. Figure 3 shows the fBEAT output under the following conditions:
1. fRX and fTX are synchronized (the output will be a constant 1, only sampling D(0)) .
2. Ideal (no jitter) measurements when fTX is set to under-sample. The output will be a low-frequency repeating 1-0 pattern.
3. Jitter measurement when fTX is set to under-sample. The output will capture jitter before and after the ideal transitions.
Jitter analysis

Fig. 3. Comparison of fBEAT with and without jitter.
The jitter analysis circuit uses fBEAT to measure the rms jitter using an algorithm based on the CDF, that is, the cumulative distribution function [2] . High-frequency jitter is measured by aligning the median edge positions (because they track low-frequency jitter) of each captured group of unstable bits.
After the rms jitter value is computed, the value is shifted out while being simultaneously compared on-chip with shifted-in test limits, so that pass/fail bits can be output too, for both the lower limit and the upper limit.
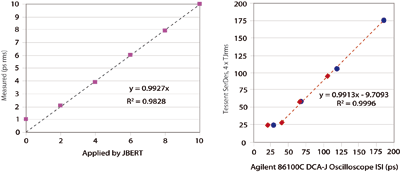
Jitter measurements taken using embedded methods have excellent correlation with those taken using traditional techniques and high-end test equipment. For instance, results for a sample SerDes obtained using EDA SerDes test software (Mentor Graphics’ Tessent SerdesTest) and that measured using test equipment from Agilent and Tektronix (Fig. 4 ) compare very favorably.

Fig. 4. Correlation of Tessent SerdesTest results with that from high-end Tektronix Agilent and Agilent Tektronix benchtop test equipment.
For the results graphed in Fig. 4 , random noise was injected into a 5 Gbit/s signal using an Agilent JBERT. The random jitter (RJ) was measured using a Tektronix 12.5-GHz-bandwidth oscilloscope and Tessent SerdesTest. The results correlate all the way to the noise floor of the receiver.
In the second experiment (see Fig. 4) , jitter caused by inter-symbol interference (ISI) was measured using an Agilent 86100C oscilloscope and Tessent SerdesTest. Again, the results correlate extremely well. ■
References
1. S. Sunter, A. Roy, “Structural Tests for Jitter Tolerance in SerDes Receivers”, Proc. of ITC , Oct. 2005.
2. S. Sunter, A. Roy, J-F Coté, “An Automated, Complete Structural Test Solution for SERDES”, Proc. of International Test Conference (ITC) , Oct. 2004.
About the Author
Dave Macemon is a marketing manager for the Silicon Test Solutions division of Mentor Graphics, and has also served as technical marketing manager. Before coming to Mentor, Macemon held engineering management positions at Dell and SiQual. Macemon earned a B.S. in electrical engineering from the University of Kentucky in Lexington
Advertisement
Learn more about Mentor Graphics


