BY MARTIN ROWE
Senior Technical Editor, Test & Measurement, EDN and EE Times
www.edn.com , www.eetimes.com
Radio frequency (RF)/microwave engineers use vector-network analyzers (VNAs) to characterize components such as connectors, cable, filters, amplifiers, PCB traces, and the like. VNAs have also become important tools for signal integrity engineers. But the high-end bench VNAs that these engineers often use are expensive, running hundreds of thousands of dollars. In recent years, a class of lower-cost handheld and USB VNAs have made scattering parameter (S-parameter) measurements available to new applications. Applications now include materials characterization, snow depth and composition, soil composition, medical imaging, and others.
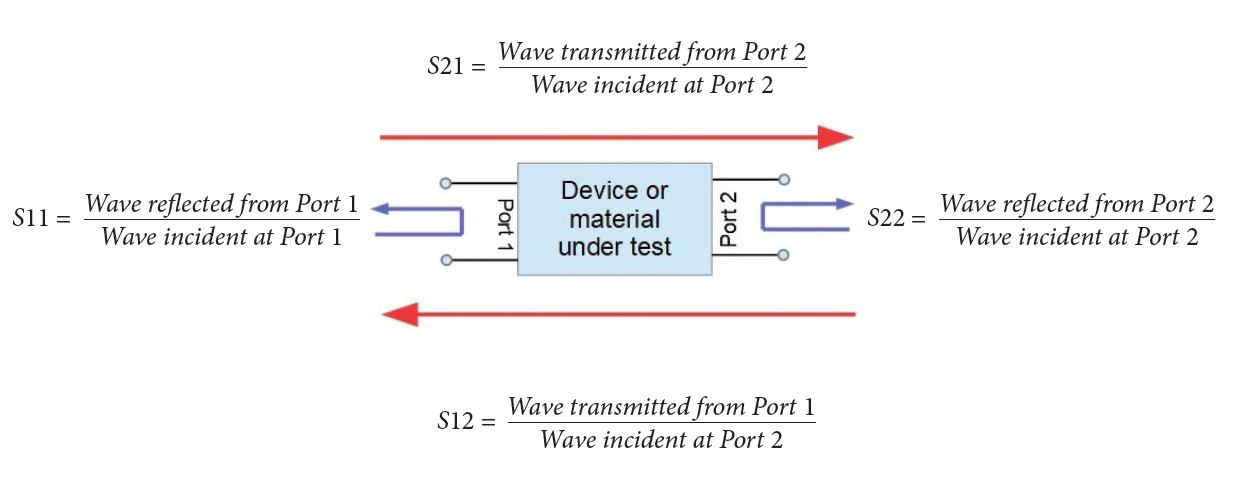
A VNA is essentially a high-frequency source-measure unit. It excites an object or circuit to a range of RF frequencies and measures the response in the form of S-parameters (Ref. 1, 2 ). S-parameters provide information on signal power (amplitude and phase) that enters, exits, and is reflected by a device, object, or material under test. Most portable and USB VNAs provide two ports, wherein each port can both transmit and receive RF waves. That results in four measurements, often described as a 2 × 2 matrix. Fig. 1 shows the matrix and the four S-parameters.

Fig. 1: A two-port device, system, or object under test connects to a two-port VNA, resulting in a 2 × 2 matrix of S-parameters.
S11 and S21 are referred to as forward S-parameters because the incident wave enters the device or material under test at Port 1. S11 is defined as the ratio of the wave reflected from Port 1 to the incident wave entering at Port 1 (Ref. 3 ). S21 is defined as the ratio of the wave exiting from Port 2 to the incident wave entering at Port 1.
S12 and S22 are the reverse S-parameters. S22 is the ratio of the wave reflected from Port 2 divided by the incident wave entering at Port 2. S12 is the ratio of the wave exiting from Port 1 to the incident wave entering at Port 2. S-parameter values (amplitude and phase) change with frequency.
The DUT in Fig. 1 need not be an electrical device; it can be almost anything. You just need a way to send and receive signals to and from the VNA. Electrical devices often have connectors to connect it to the VNA ports through cables or they can attach to a PCB. Other objects or substances may need a different interface such as an antenna.
Antenna in the snow
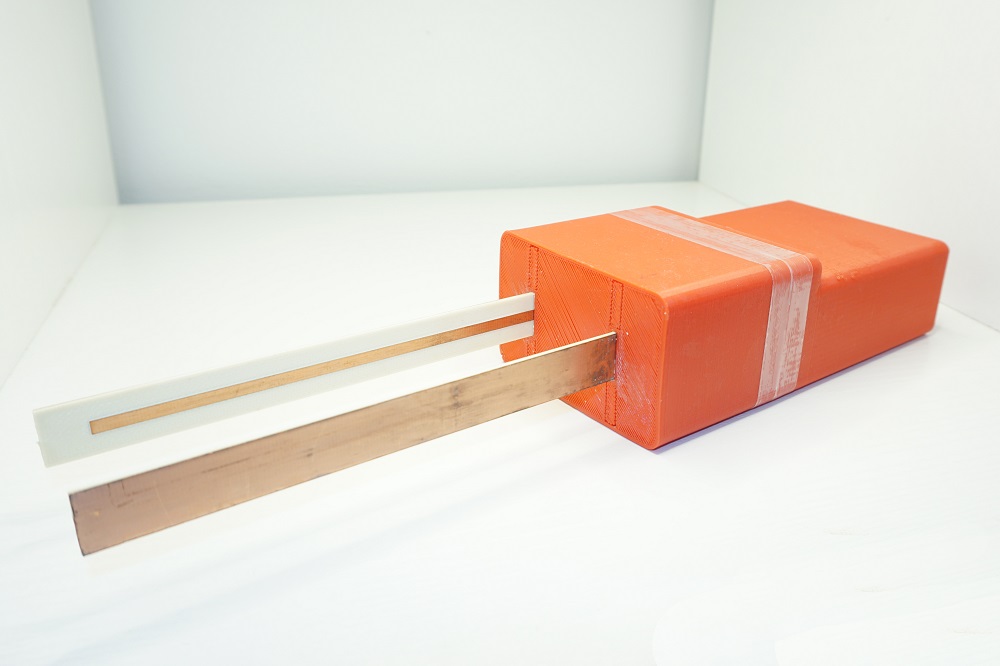
Jakop Reistad used a VNA as part of his master’s thesis (Ref. 4 ) to evaluate a resonance probe (Fig. 2 ) designed for sending and receiving signals through the Norwegian snow to measure snow density and composition.

Fig. 2: This probe is designed to connect to a VNA for measuring the density and composition of snow. Image: Jackop Reistad, Arctic University of Norway.
Reistad used a miniVNA Tiny, an under-$600 USB VNA from Mini Radio Solutions, to send and receive signals. Its frequency range is 1 MHz to 3 GHz.
“The dielectric constant is a complex quantity with a real part and an imaginary part,” explained Reistad. “For dry snow, the dielectric constant is almost entirely real, and the real part changes almost linearly with snow density. As water content increases, the complex part dominates. Therefore, the two main ‘physical’ parameters of interest are density and water content.”
To calculate the dielectric constant and, thus, the snow density, Reistad had to first find the snow’s resonant frequency, which can be obtained from S-parameter measurements. “The resonance frequency is inversely proportional to the dielectric constant. We can find the wetness by studying the quality factor of the resonant probe. Increased water content will lower the quality factor and broaden the resonance peaks.”
In another snow application, a VNA was used to measure the ice depth on polar regions by injecting an RF signal into the ice and measuring the returned power. A change in phase from successive measurements provides the data needed to calculate changes in ice thickness. Absolute thickness can be calculated by taking phase measurements at different frequencies or by taking an inverse Fast Fourier Transform (iFFT) of the frequency-domain data. These measurements let scientists see the effects of climate change on polar ice. All of these methods produce results similar to radar, where an RF pulse is injected into the ice (Ref. 5 ).
Material characterization
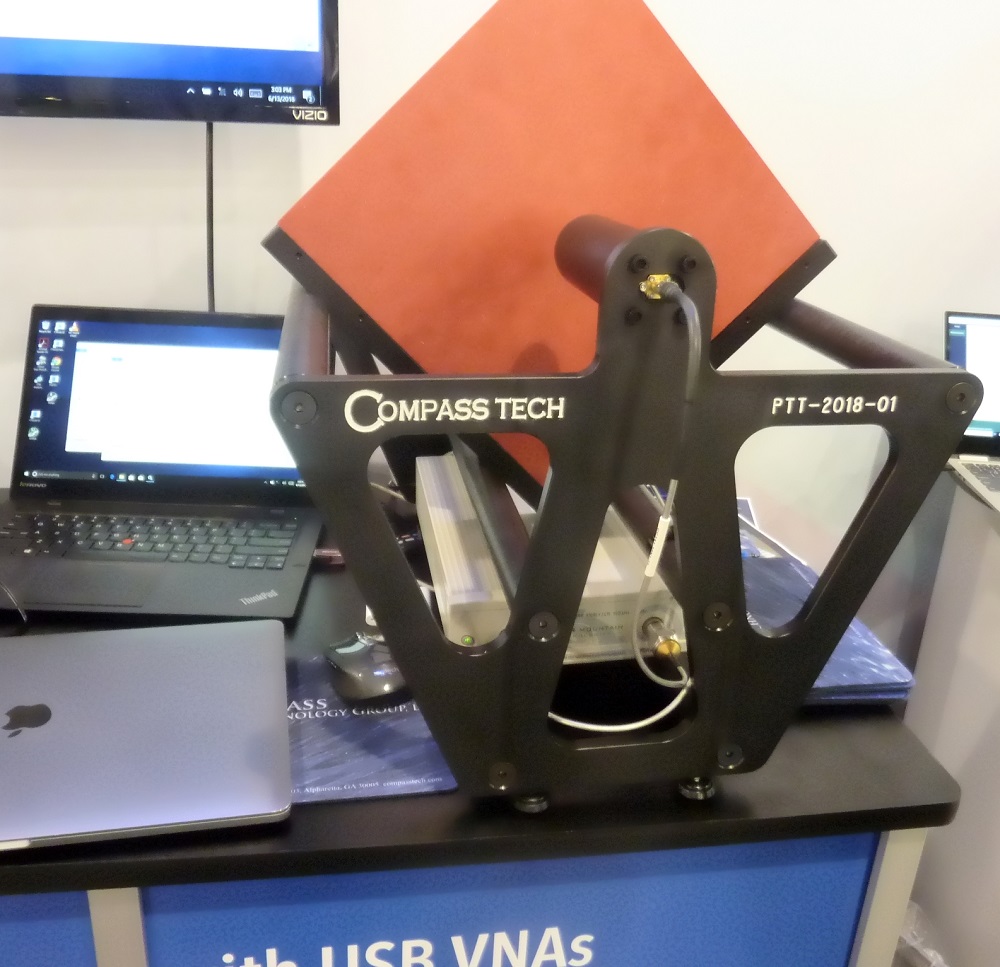
Compass Technology Group LLC develops custom fixtures that its customers use to obtain the intrinsic properties of materials. “A material’s intrinsic properties describe how it will behave,” said John Schultz, chief scientist at Compass Technology. Fig. 3 shows a test fixture that the company displayed at the 2018 International Microwave Symposium.

Fig. 3: A test fixture from Compass Technology uses custom antennas to send and receive signals from a VNA to the material under test. Image: Martin Rowe.
In Fig. 3 , a VNA from Copper Mountain Technologies excites the material and calculates S-parameters. From amplitude and phase, proprietary software calculates intrinsic properties of the material under test.
The parameters of interest are the real and imaginary components of a material’s permittivity and magnetic permeability. Materials tested at Compass Technology include low-loss and high-loss materials. Low-loss materials are often used in antennas while high-loss materials may become absorbers. While the company usually tests materials prior to their integration into a design, it has also tested finished products such as aircraft canopies.
Additional uses
Mark Ashcroft of USB VNA manufacturer Pico Technology has seen unusual uses for the company’s PicoVNA. For example, a VNA can be used to test the integrity of electrical bolts that have typically 60 A to 100 A of current.
In this application, S11 is the important parameter. Should a weld fracture over time, S11 will change as more energy will reflect to the transmit port. An iFFT of a resonant-frequency plot generated from S11 and S21 measurements produces a time-domain plot, which can indicate the location of a fracture.
VNAs have proven their usefulness in scientific as well as engineering measurements. They just need an antenna or other probe to inject a signal into a material under test and extract reflected and transmitted power.
References:
1. Maliniak, D. (Nov. 6, 2014). S-parameters basics. EDN . Retrieved from https://ubm.io/2uulDia .
2. Nelson, R. (Feb. 1, 2001). What are S-parameters, anyway? EDN . Retrieved from https://ubm.io/2Nob0Er .
3. Bogatin, E. (2010). Signal and Power Integrity — Simplified (2nd ed.). Prentice Hall Pearson Education.
4. Reistad, J. (2018).A compact portable resonance probe system for in situ measurements of snow conditions . Retrieved from https://bit.ly/2NZP2sm .
5. Herrold, B. A. (2013). Complete Vector Network Analyzer Approach to Ice Penetrating Radar System . Retrieved from https://bit.ly/2NYz1mv .
Advertisement


